Editor's Note: Below is a brief excerpt and chart from today's Early Look written by Hedgeye CEO Keith McCullough. Click here to learn more.
"... Notwithstanding the newfound bull market narrative that rising gas prices are going to stimulate the consumer, here’s what you had to be long last week (in US Equity Style Factor terms) to have crushed my bearish view:
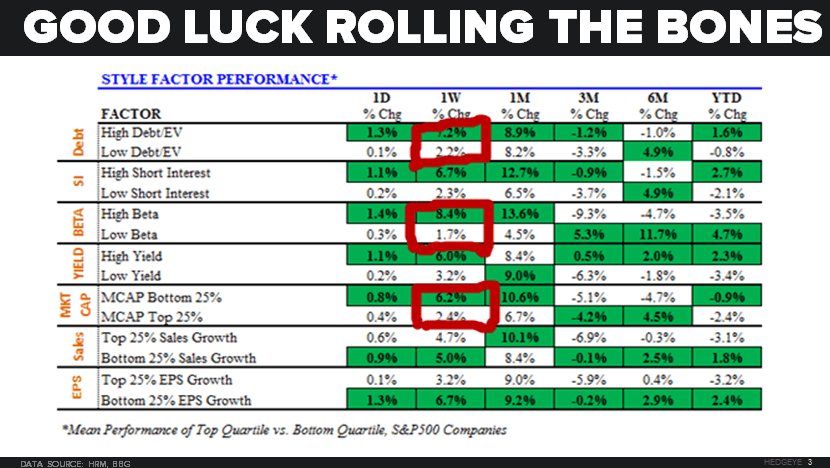
- High Beta Stocks were +8.4% on the week to -3.5% YTD
- High Debt (to Enterprise Value) Stocks were +7.2% on the week to +1.6% YTD
- Slow-Growth (EPS) Stocks were +6.7% on the week to +2.4% YTD
- High Short Interest Stocks were +6.7% on the week to +2.7% YTD
- Small Cap Stocks were +6.2% on the week to -0.9% YTD
*Mean performance of Top Quintile vs. Bottom Quintile (SP500 Companies)"