

CME Group (CME) punched out its finalized monthly stats for February this week with rare strength across the board for a financials company. Trading volume in the 2nd month of the year put in new all-time highs at 18.7 million contracts per day, up 18% year-over-year and exhibiting momentum by taking out the prior high just set a month ago in January. In addition, the exchange on the margin has increased its base rate in interest rates and energy contracts which is resulting in rare pricing power in financial services. The 3 month moving average of rate per contract (RPC) in February settled at $0.77 per contract, up +2% year-over-year from $0.75 in 1Q15. In a rare combination of increasing volume AND price, CME (and to a lesser extent ICE) is one of the few growth stories in financials. We prefer CME to ICE with open interest up +12% year over year in Chicago versus the more market data driven emphasis in Atlanta with open interest only up 6%. We value CME on $5 in earnings power per share still +10% ahead of consensus.

Weekly Activity Wrap Up
Cash equity and options volumes grew week over week while futures volume shrunk. 1Q16TD average daily volumes (ADVs) remain well above their year-ago levels in all three categories. Cash equity volume for the week came in at 8.5 billion shares traded per day, bringing the 1Q16TD ADV to 9.0 billion, up +30% Y/Y. Futures activity at CME and ICE came in at 20.9 million contracts traded per day this week, bringing the 1Q16TD ADV to 24.0 million, up +20% Y/Y. Additionally, CME's open interest currently tallies 113.4 million contracts, +24% higher than the 91.3 million pending at the end of 2015, which will drag trading volume higher going forward. Options came in at 16.1 million contracts traded per day this week, bringing the 1Q16TD ADV to 17.8 million, up +15% Y/Y.

U.S. Cash Equity Detail
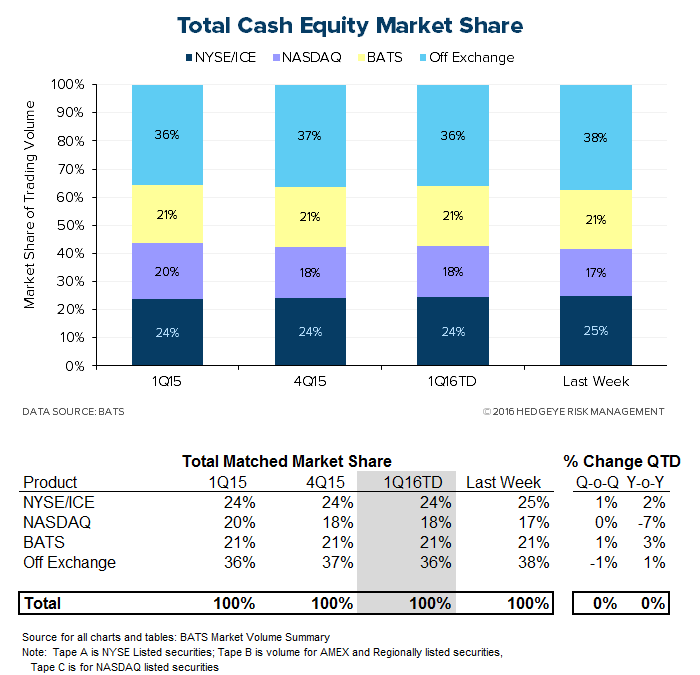
U.S. cash equities trading came in at 8.5 billion shares per day this week, bringing the 1Q16TD average to 9.0 billion shares per day. That marks +30% Y/Y and +28% Q/Q growth. The market share battle for volume is mixed. The New York Stock Exchange/ICE is taking a 24% share of first-quarter volume, which is consistent with the prior quarter and year-ago quarter, while NASDAQ is taking an 18% share, +9 bps higher Q/Q but -139 bps lower than one year ago.

U.S. Options Detail
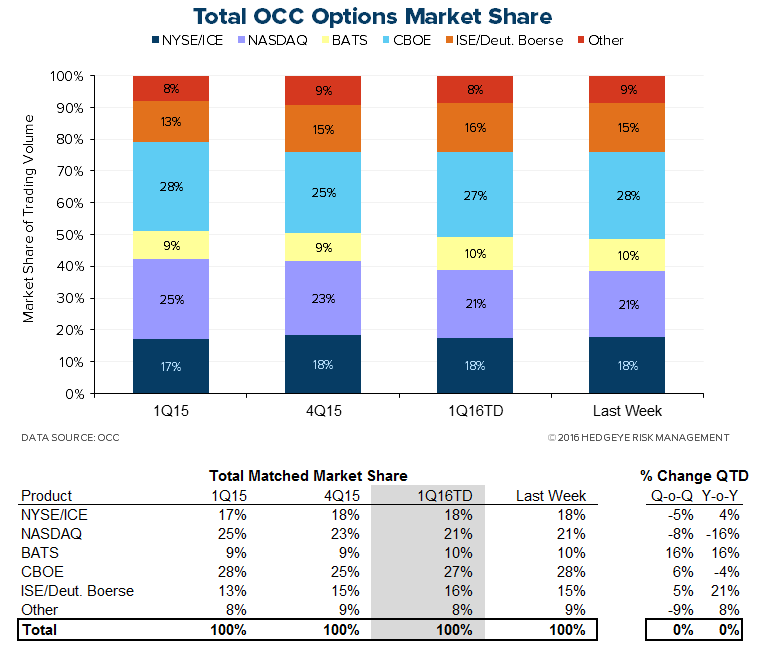
U.S. options activity came in at a 16.1 million ADV this week, bringing the 1Q16TD average to 17.8 million, a +15% Y/Y and +11% Q/Q expansion. In the market share battle amongst venues, NYSE/ICE has been trending downward at a moderate pace, but at an 18% share it is +60 bps higher than the year-ago quarter. Meanwhile, NASDAQ's recent declines bring it -400 bps lower than 1Q15. CBOE's market share is down -126 bps Y/Y but has improved recently; its 27% share of 1Q16TD volume is up +152 bps from 4Q15. BATS and ISE/Deutsche have been taking share from the competing exchanges, with BATS up to a 10% share from 9% a year ago and ISE/Deutsche taking 16%, up from 13% a year ago.

U.S. Futures Detail
15.7 million futures contracts traded through CME Group this week, bringing the 1Q16TD average to 18.2 million, a +21% Y/Y and +38% Q/Q expansion. Additionally, CME open interest, the most important beacon of forward activity, currently sits at 113.4 million CME contracts pending, good for +24% growth over the 91.3 million pending at the end of 4Q15, an improvement from last week's +21%.
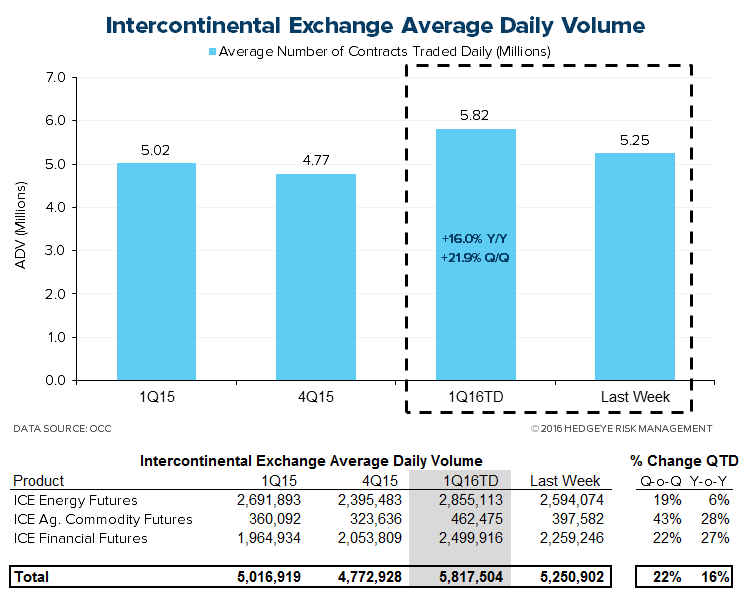
Contracts traded through ICE came in at 5.3 million per day this week, bringing the 1Q16TD ADV to 5.8 million, +16% Y/Y and +22% Q/Q growth. ICE open interest this week tallied 68.6 million contracts, a +8% expansion versus the 63.7 million contracts open at the end of 4Q15, a deterioration from last week's +9%.


Monthly Historical View
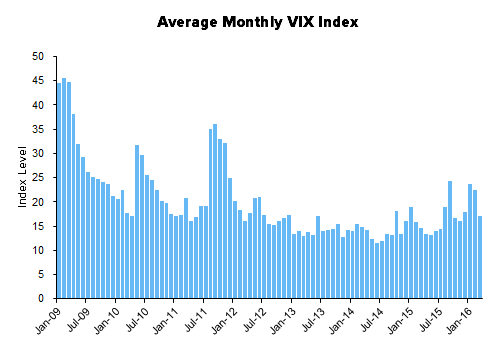
Monthly activity levels give a broader perspective of exchange based trends. As volatility levels, measured by the VIX, MOVE, and FX Vol should rise to normal levels after the drastic compression this cycle, we expect all marketplaces to experience higher activity levels.


Please let us know of any questions,
Jonathan Casteleyn, CFA, CMT
Joshua Steiner, CFA
