
Below is the breakdown of this morning's labor data from Joshua Steiner and the Hedgeye Financials team. If you would like to setup a call with Josh or Jonathan or trial their research, please contact
99 Problems
Buried like an Easter egg at the end of each of our weekly claims notes are a few charts showing the 2-10 yield spread quarterly back to 2008. For anyone not paying attention, the spread has been compressing steadily since its 4Q13 peak of 2.41%. As of today, the spread stands at 99 basis points (the 1Q16TD average is 113 bps).
This is a problem for banks. First, this is far and away the tightest spread environment seen in the post-crisis period so it simply hurts in absolute terms. Second, in RoC terms, if we hold the current 99 bps flat through quarter-end, the 1Q16 average spread will be down ~28 bps vs the 4Q15 average, which will be the second fastest rate of compression since 2011. Banks obviously feel the pain, even if it flows through on a lag. The point is that with global macro pressures growing, expect spreads and the read through to US and Global banking businesses to continue compressing/darkening.


The Labor Market
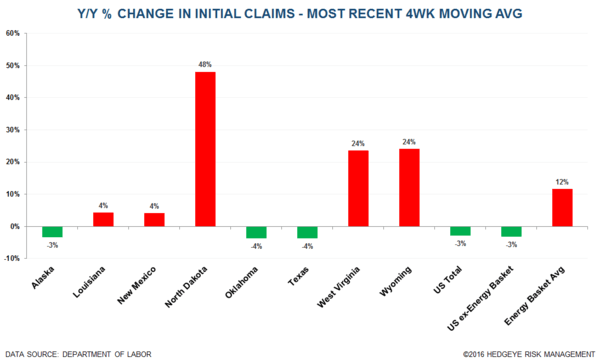
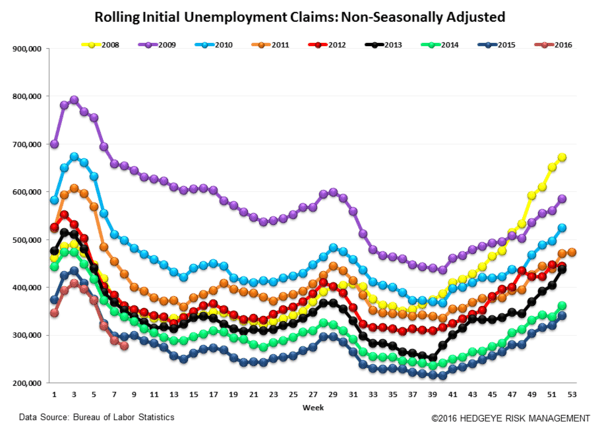
The Labor Data is again less good this week. Seasonally adjusted claims rose 10k week over week to 272k, while claims continue to grow year-over-year in energy states, as the following three charts show.


The Numbers
Initial jobless claims rose 10k to 272k from 262k WoW. The prior week's number was not revised. Meanwhile, the 4-week rolling average of seasonally-adjusted claims fell -1.25k WoW to 272k.
The 4-week rolling average of NSA claims, another way of evaluating the data, was -6.7% lower YoY, which is a sequential improvement versus the previous week's YoY change of -2.8%.


Joshua Steiner, CFA
Jonathan Casteleyn, CFA, CMT