Editor's Note: Below is a brief excerpt and chart from today's Early Look written by Hedgeye U.S. Macro analyst Christian Drake. Click here to learn more.
"... Brick!: New Home Sales threw up a brick to start 2016, falling to -5.2% YoY and marking the slowest pace of growth and the 1st negative year-over-year print since June of 2014. The median price of New Homes declined -5.7% MoM and decelerated to -4.5% YoY – the 1st consecutive months of YoY decline since 2011. Further, sales growth was 0% or negative across all price tiers for the first time since the 2014 trough.
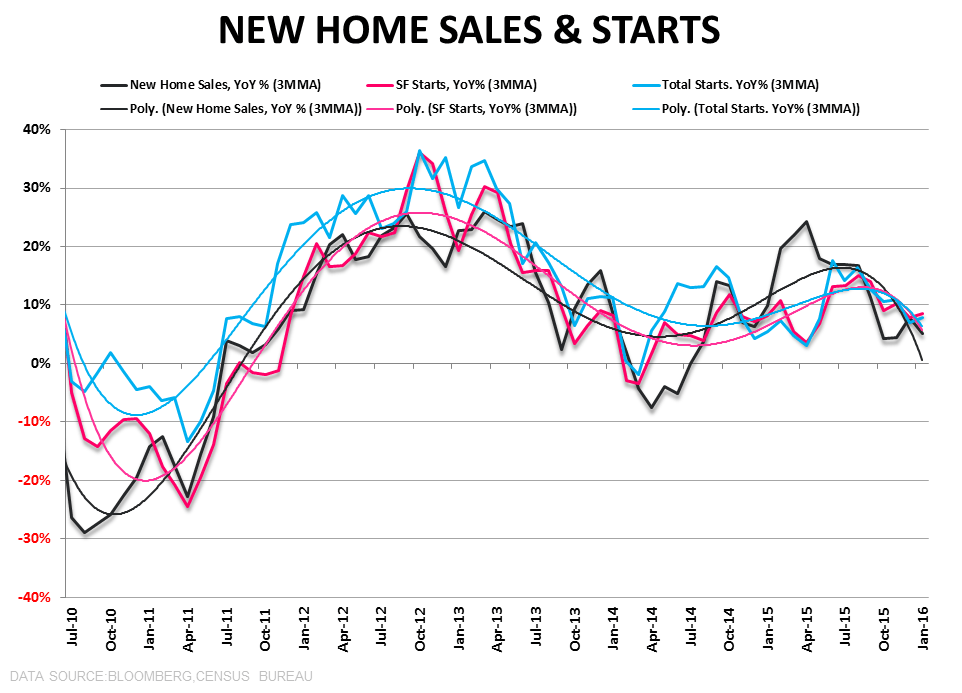
Yes, the outsized decline in the West region (weather impact) was likely a distortion that resolves higher but I also didn’t hear anyone call out the 100% YoY gain in the Northeast (weather benefit) as a positive distortion. NHS is the most volatile housing series there is and carries a large standard error with significant subsequent revisions so we don’t take an overly convicted view of any single month in isolation but as the Chart of the Day below shows, the multi-month trend across New Home Sales and Starts has been one of slowing."