

Investment Company Institute Mutual Fund Data and ETF Money Flow:
In the 5-day period ending February 17th, taxable bond funds saw their first inflow in 15 weeks, although only a modest +$107 million. Also within bonds, fixed income ETFs took in +$2.9 billion. That amount included +$448 million in contributions to the long duration Treasury TLT fund, which has now increased year-to-date assets by an astounding +$3.0 billion or +44%. Meanwhile, investors continue to exit equity mutual funds and ETFs, drawing down another -$4.1 billion from the category, even during a week with declining volatility. International equity funds, however, were the exception within total equity products, taking in +$1.0 billion, as the category continues to experience stable inflows. Finally, investors seeking safety shored up +$8 billion in money market funds as the move to build cash is accelerating.

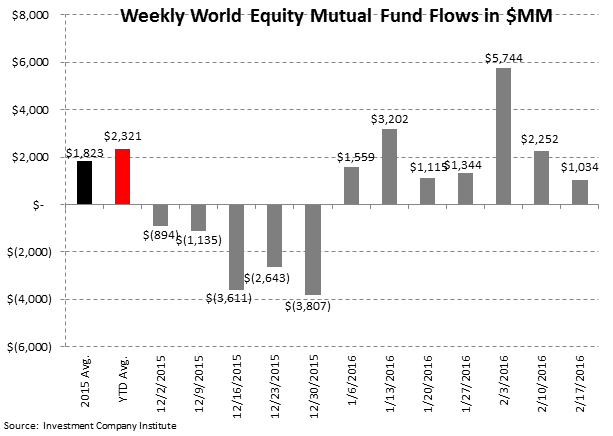
In the most recent 5-day period ending February 17th, total equity mutual funds put up net outflows of -$1.2 billion, trailing the year-to-date weekly average outflow of -$1.0 billion but outpacing the 2015 average outflow of -$1.5 billion. The outflow was composed of international stock fund contributions of +$1.0 billion and domestic stock fund withdrawals of -$2.3 billion. International equity funds have had positive flows in 41 of the last 52 weeks while domestic equity funds have had only 5 weeks of positive flows over the same time period.
Fixed income mutual funds put up net inflows of +$964 million, outpacing the year-to-date weekly average outflow of -$873 million and the 2015 average outflow of -$475 million. The inflow was composed of tax-free or municipal bond funds contributions of +$857 million and taxable bond funds contributions of +$107 million.
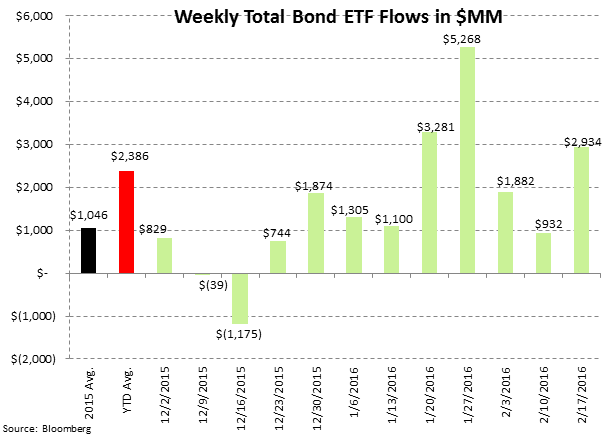
Equity ETFs had net redemptions of -$2.9 billion, slightly better than the year-to-date weekly average outflow of -$4.4 billion but trailing the 2015 average inflow of +$2.8 billion. Fixed income ETFs had net inflows of +$2.9 billion, outpacing the year-to-date weekly average inflow of +$2.4 billion and the 2015 average inflow of +$1.0 billion.
Mutual fund flow data is collected weekly from the Investment Company Institute (ICI) and represents a survey of 95% of the investment management industry's mutual fund assets. Mutual fund data largely reflects the actions of retail investors. Exchange traded fund (ETF) information is extracted from Bloomberg and is matched to the same weekly reporting schedule as the ICI mutual fund data. According to industry leader Blackrock (BLK), U.S. ETF participation is 60% institutional investors and 40% retail investors.
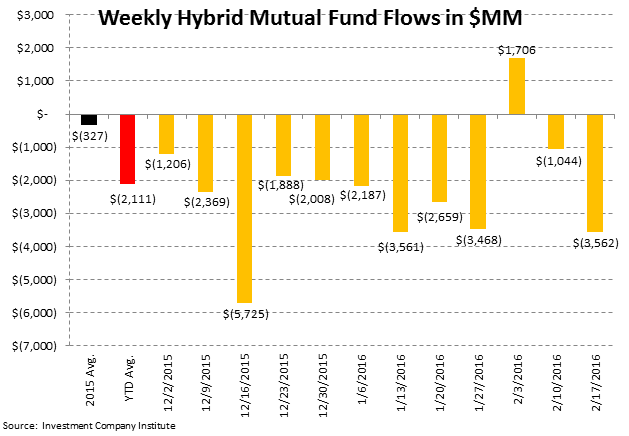
Most Recent 12 Week Flow in Millions by Mutual Fund Product: Chart data is the most recent 12 weeks from the ICI mutual fund survey and includes the weekly average for 2015 and the weekly year-to-date average for 2016:


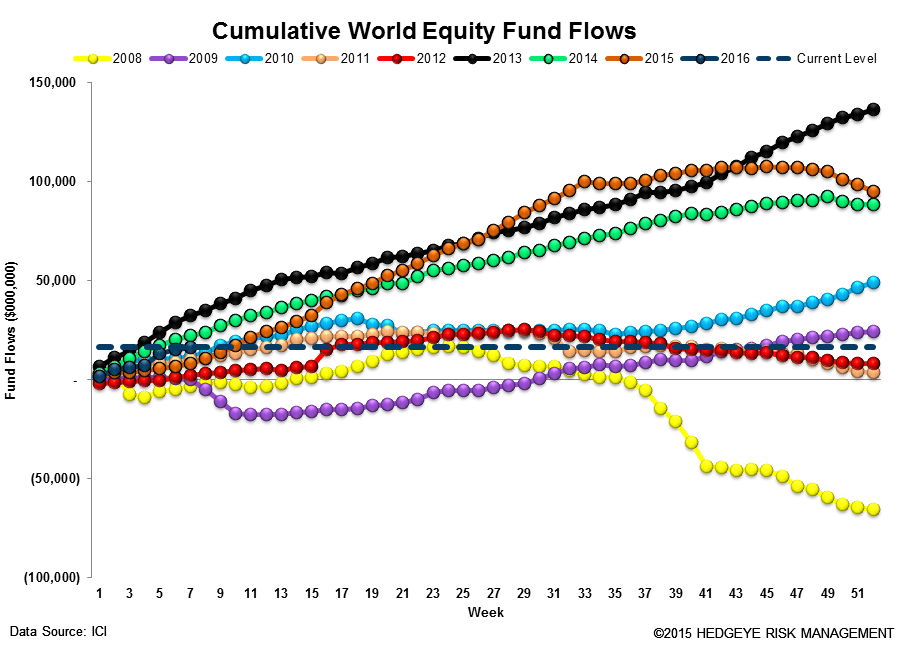
Cumulative Annual Flow in Millions by Mutual Fund Product: Chart data is the cumulative fund flow from the ICI mutual fund survey for each year starting with 2008.


Most Recent 12 Week Flow within Equity and Fixed Income Exchange Traded Funds: Chart data is the most recent 12 weeks from Bloomberg's ETF database (matched to the Wednesday to Wednesday reporting format of the ICI), the weekly average for 2015, and the weekly year-to-date average for 2016. In the third table are the results of the weekly flows into and out of the major market and sector SPDRs:

Sector and Asset Class Weekly ETF and Year-to-Date Results: With Treasury inflows trending, the long duration Treasury TLT ETF took in another +$448 million or +5% last week. Also, the utilities XLU fund took in +$469 million or +6%.

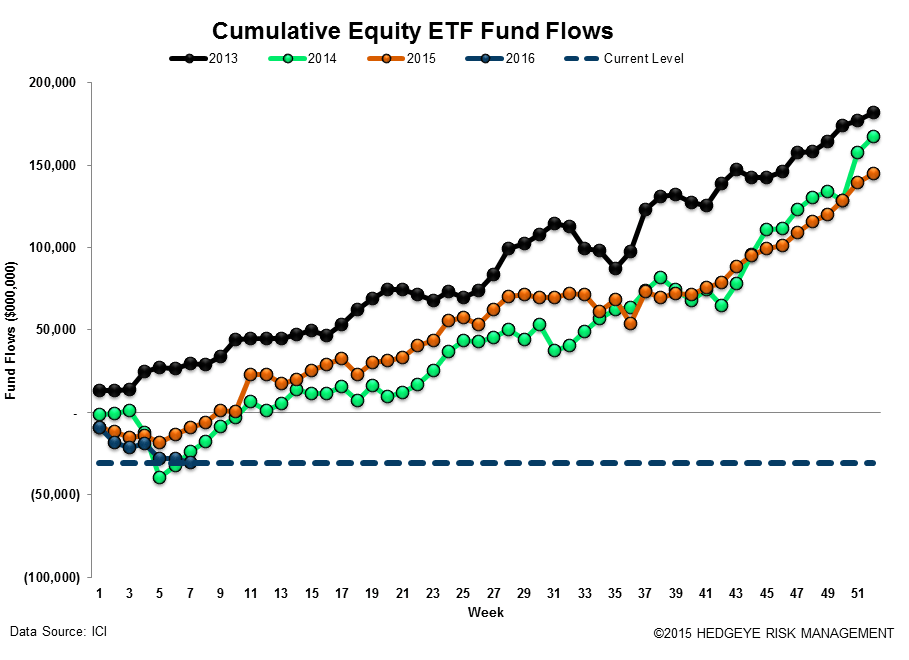
Cumulative Annual Flow in Millions within Equity and Fixed Income Exchange Traded Funds: Chart data is the cumulative fund flow from Bloomberg's ETF database for each year starting with 2013.

Net Results:
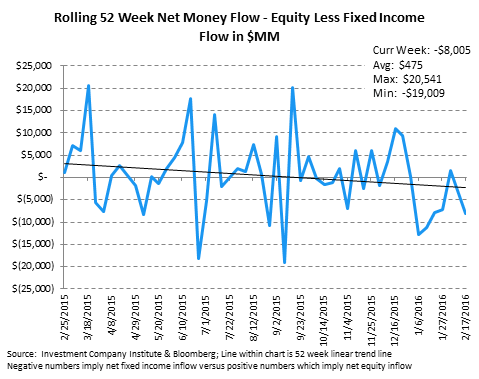
The net of total equity mutual fund and ETF flows against total bond mutual fund and ETF flows totaled a negative -$8.0 billion spread for the week (-$4.1 billion of total equity outflow net of the +$3.9 billion inflow to fixed income; positive numbers imply greater money flow to stocks; negative numbers imply greater money flow to bonds). The 52-week moving average is +$475 million (more positive money flow to equities) with a 52-week high of +$20.5 billion (more positive money flow to equities) and a 52-week low of -$19.0 billion (negative numbers imply more positive money flow to bonds for the week.)
Exposures: The weekly data herein is important for the public asset managers with trends in mutual funds and ETFs impacting the companies with the following estimated revenue impact:

Jonathan Casteleyn, CFA, CMT
Joshua Steiner, CFA
