

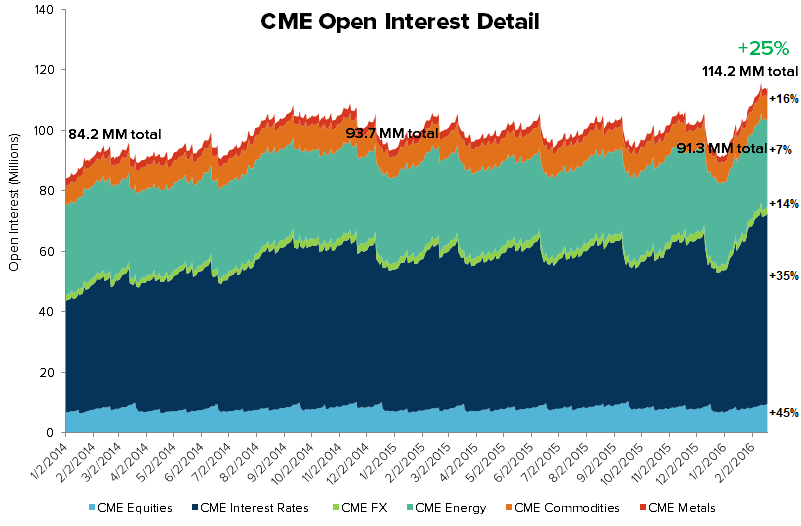
The biggest risk for shareholders in the exchange sector is that volatility dries up and liquidity in the market recedes. This was the case in 2011 as volatility spiked when the U.S. lost is AAA sovereign credit rating from S&P and the 13.3 million average daily contract volume on CME Group (CME) cascaded down to just 11.4 million contracts per day for 2012. This analog is important because this is the risk for CME longs for 2016 and 2017. Open interest however signaled this trading slack in the '11/'12 slough off as by September of 2011, open interest tallies were comping negatively by late summer portending the forthcoming slack in trading for 2012. Fast forwarding 4 years, open interest tallies currently couldn't be more positive, with the 114 million contracts in the backlog threatening to set new monthly highs each rolling 30 day period. The combination of new electronic (digital) trading in options and new product introduction in rates (the back end of the Eurodollar curve and also new Treasury products), makes the stock one of the few solid long positions in U.S. Financials currently.


Weekly Activity Wrap Up
Volatility and volume eased in tandem this week, however average daily volumes (ADVs) are still tracking well above 1Q15 ADVs creating solid year-over-year growth. Cash equity volume for the week came in at 8.7 billion shares traded per day, bringing the 1Q16TD ADV to 9.3 billion, up +35% Y/Y. Futures activity at CME and ICE came in at 21.3 million contracts traded per day this week, bringing the 1Q16TD ADV to 24.5 million, up +22% Y/Y. Additionally, CME's open interest currently tallies 114.2 million contracts, 25% higher than the 91.3 million pending at the end of 2015, which will drag trading volume higher going forward. Options came in at 17.3 million contracts traded per day this week, bringing the 1Q16TD ADV to 18.5 million, up +19% Y/Y.

U.S. Cash Equity Detail
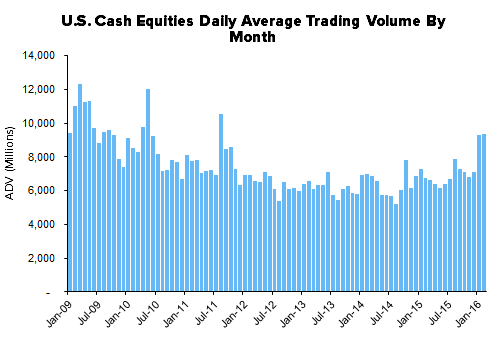
U.S. cash equities trading came in at 8.7 billion shares per day this week, bringing the 1Q16TD average to 9.3 billion shares per day. That marks +35% Y/Y and +32% Q/Q growth. The market share battle for volume is mixed. The New York Stock Exchange/ICE is taking a 24% share of first-quarter volume, which is consistent with the prior quarter and year-ago quarter, while NASDAQ is taking a 19% share, +49 bps higher Q/Q but -99 bps lower than one year ago.


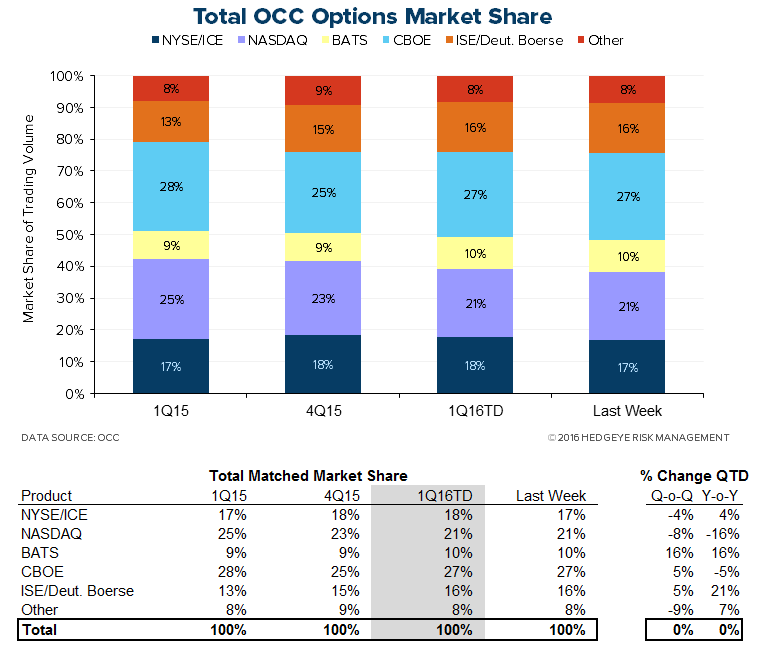
U.S. Options Detail
U.S. options activity came in at a 17.3 million ADV this week, bringing the 1Q16TD average to 18.5 million, a +19% Y/Y and +16% Q/Q expansion. In the market share battle amongst venues, NYSE/ICE has been trending downward at a moderate pace, but at an 18% share it is +69 bps higher than the year-ago quarter. Meanwhile, NASDAQ's recent declines bring it -396 bps lower than 1Q15. CBOE's market share is down -141 bps Y/Y but has improved recently; its 27% share of 1Q16TD volume is up +137 bps from 4Q15. BATS and ISE/Deutsche have been taking share from the competing exchanges, with BATS up to a 10% share from 9% a year ago and ISE/Deutsche taking 16%, up from 13% a year ago.

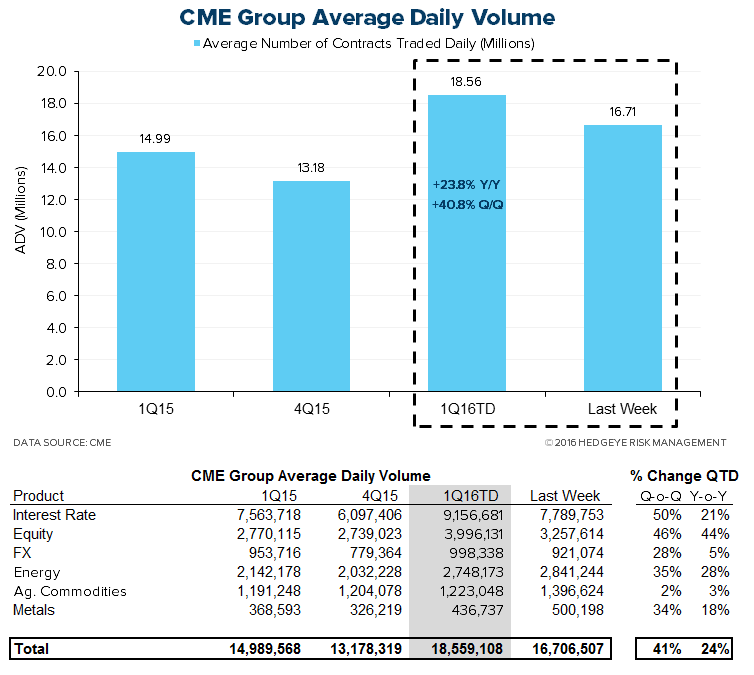
U.S. Futures Detail
16.7 million futures contracts traded through CME Group this week, bringing the 1Q16TD average to 18.6 million, a +24% Y/Y and +41% Q/Q expansion. Additionally, CME open interest, the most important beacon of forward activity, currently sits at 114.2 million CME contracts pending, good for +25% growth over the 91.3 million pending at the end of 4Q15, although that is slightly lower than last week's +27%.
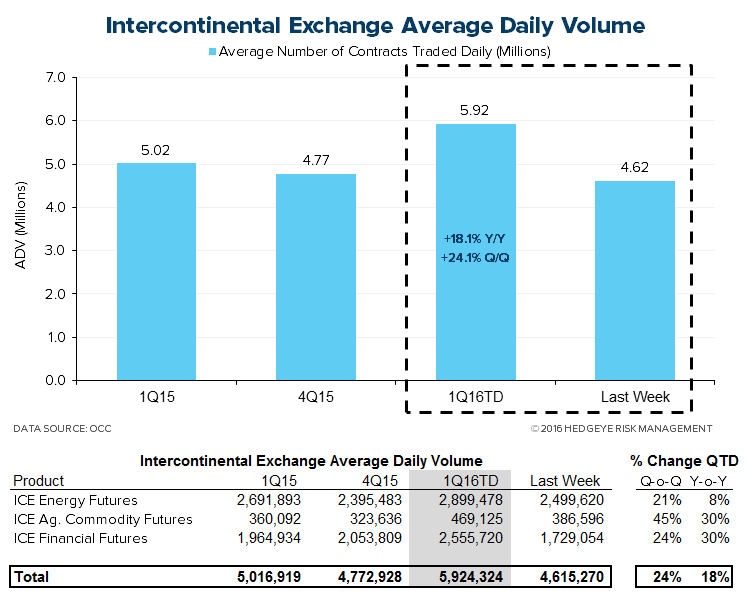
Contracts traded through ICE came in at 4.6 million per day this week, bringing the 1Q16TD ADV to 5.9 million, +18% Y/Y and +24% Q/Q growth. ICE open interest this week tallied 69.5 million contracts, a +9% expansion versus the 63.7 million contracts open at the end of 4Q15, a contraction from +10% last week.

Monthly Historical View
Monthly activity levels give a broader perspective of exchange based trends. As volatility levels, measured by the VIX, MOVE, and FX Vol should rise to normal levels after the drastic compression this cycle, we expect all marketplaces to experience higher activity levels.


Please let us know of any questions,
Jonathan Casteleyn, CFA, CMT
Joshua Steiner, CFA
