

Investment Company Institute Mutual Fund Data and ETF Money Flow:
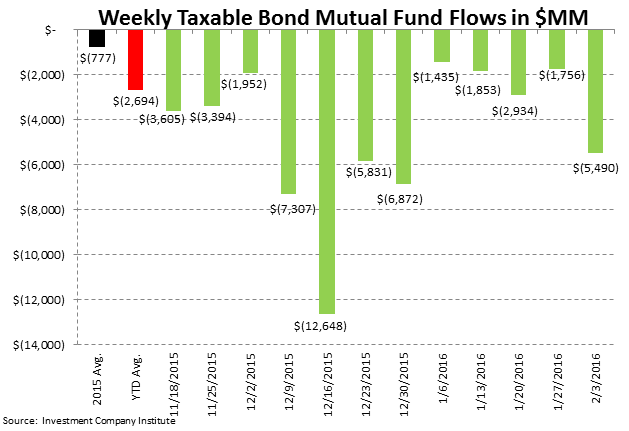
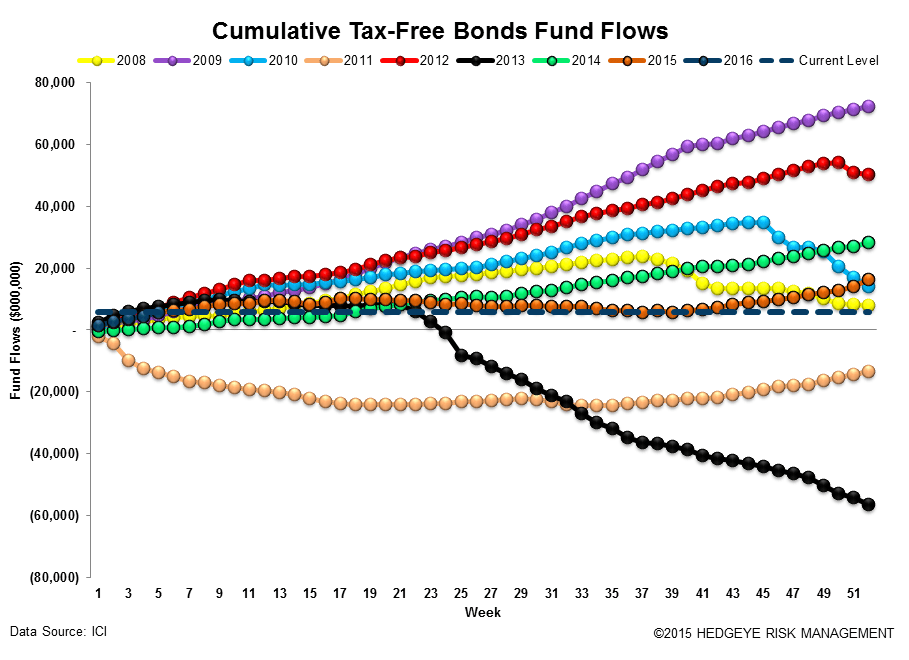
In the 5-day period ending February 3rd, investors made more aggressive allocations than they have in recent periods, drawing down -$4 billion of cash and making contributions to domestic and international equity mutual funds. Domestic equity funds experienced their first inflow in 19 weeks with investors contributing +$2.3 billion to U.S. stock funds. Additionally, international equity funds took in +$5.7 billion, their largest weekly subscription since April 2015. Passives continue to be a source of funds however with equity ETFs losing another -$8.8 billion (over $3.0 billion of this redemption was in the S&P 500 SPDR this week). In fixed income, fear abounds with taxable bond funds having its worst week in 5 with -$5.5 billion being withdrawn. Municipal bonds continued their winning streak, taking in +$1.2 billion, making it 18 straight weeks of tax-free inflows. Fixed income ETFs gained +$1.9 billion.

In the most recent 5-day period ending February 3rd, total equity mutual funds put up net inflows of +$8.1 billion, outpacing the year-to-date weekly average outflow of -$917 million and the 2015 average outflow of -$1.5 billion. The inflow was composed of international stock fund contributions of +$5.7 billion and domestic stock fund contributions of +$2.3 billion. International equity funds have had positive flows in 41 of the last 52 weeks while domestic equity funds have had only 6 weeks of positive flows over the same time period.
Fixed income mutual funds put up net outflows of -$4.3 billion, trailing the year-to-date weekly average outflow of -$1.6 billion and the 2015 average outflow of -$463 million. The outflow was composed of tax-free or municipal bond funds contributions of +$1.2 billion and taxable bond funds withdrawals of -$5.5 billion.
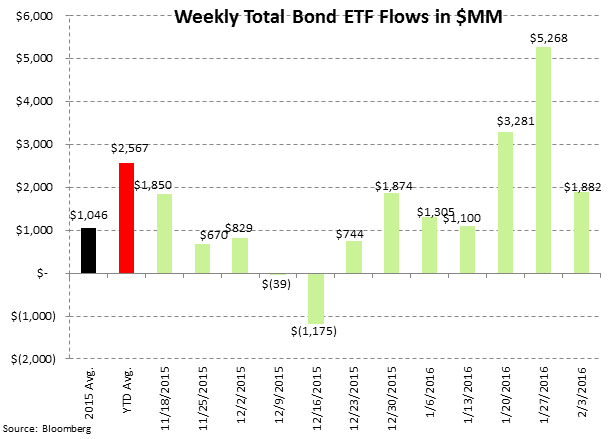
Equity ETFs had net redemptions of -$8.8 billion, trailing the year-to-date weekly average outflow of -$5.6 billion and the 2015 average inflow of +$2.8 billion. Fixed income ETFs had net inflows of +$1.9 billion, trailing the year-to-date weekly average inflow of +$2.6 billion but outpacing the 2015 average inflow of +$1.0 billion.
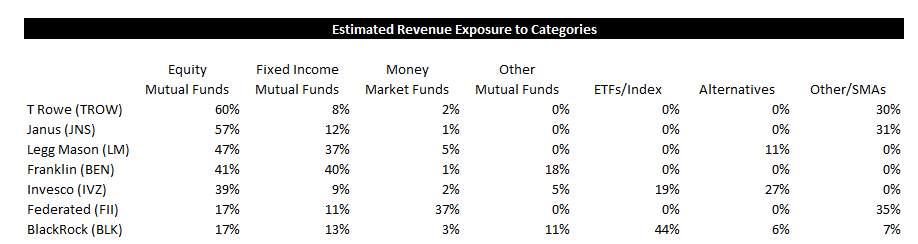
Mutual fund flow data is collected weekly from the Investment Company Institute (ICI) and represents a survey of 95% of the investment management industry's mutual fund assets. Mutual fund data largely reflects the actions of retail investors. Exchange traded fund (ETF) information is extracted from Bloomberg and is matched to the same weekly reporting schedule as the ICI mutual fund data. According to industry leader Blackrock (BLK), U.S. ETF participation is 60% institutional investors and 40% retail investors.
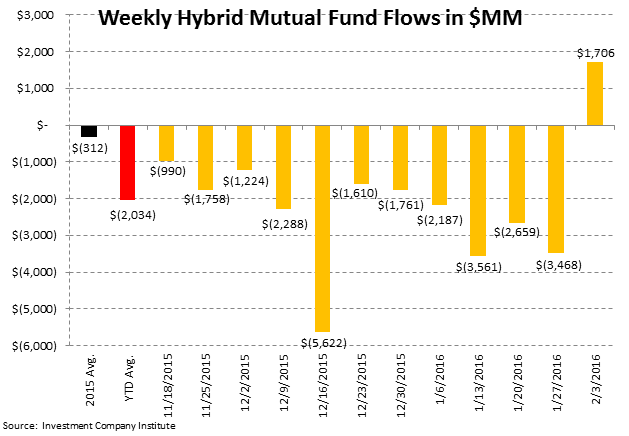
Most Recent 12 Week Flow in Millions by Mutual Fund Product: Chart data is the most recent 12 weeks from the ICI mutual fund survey and includes the weekly average for 2015 and the weekly year-to-date average for 2016:


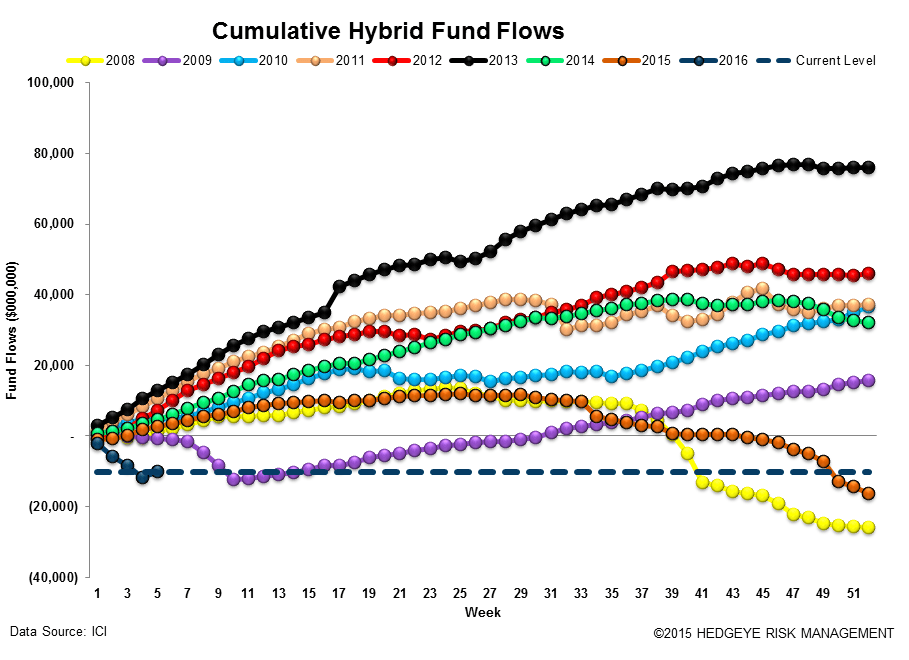
Cumulative Annual Flow in Millions by Mutual Fund Product: Chart data is the cumulative fund flow from the ICI mutual fund survey for each year starting with 2008.


Most Recent 12 Week Flow within Equity and Fixed Income Exchange Traded Funds: Chart data is the most recent 12 weeks from Bloomberg's ETF database (matched to the Wednesday to Wednesday reporting format of the ICI), the weekly average for 2015, and the weekly year-to-date average for 2016. In the third table are the results of the weekly flows into and out of the major market and sector SPDRs:

Sector and Asset Class Weekly ETF and Year-to-Date Results: In sector SPDR callouts, investors made large withdrawals from industrials and materials. The industrial XLY ETF lost -$277 million or -5% to redemptions. The materials XLB lost -$113 million or -6%.

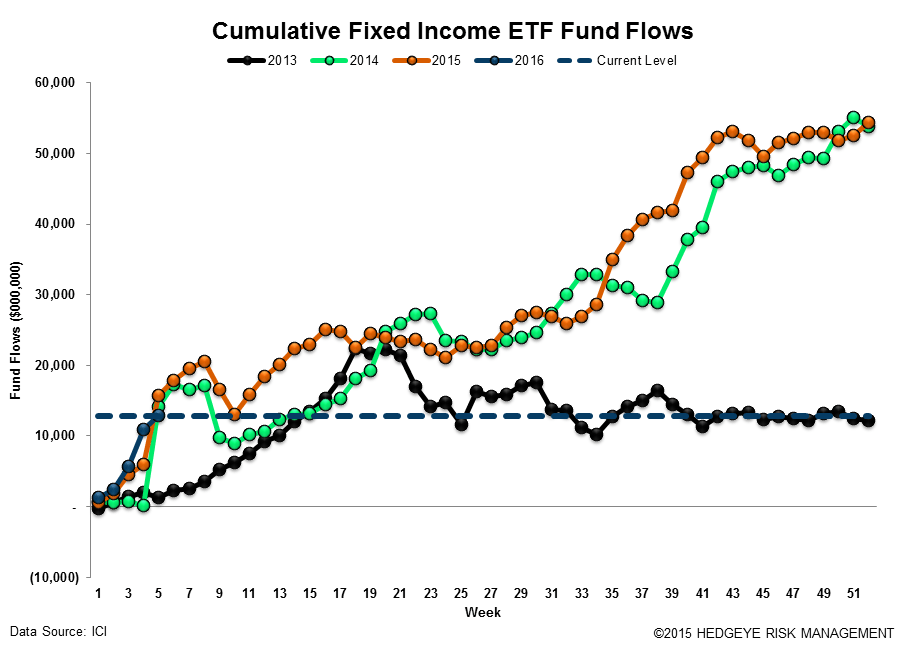
Cumulative Annual Flow in Millions within Equity and Fixed Income Exchange Traded Funds: Chart data is the cumulative fund flow from Bloomberg's ETF database for each year starting with 2013.

Net Results:
The net of total equity mutual fund and ETF flows against total bond mutual fund and ETF flows totaled a positive +$1.6 billion spread for the week (-$774 million of total equity outflow net of the -$2.4 billion outflow from fixed income; positive numbers imply greater money flow to stocks; negative numbers imply greater money flow to bonds). The 52-week moving average is +$724 million (more positive money flow to equities) with a 52-week high of +$20.5 billion (more positive money flow to equities) and a 52-week low of -$19.0 billion (negative numbers imply more positive money flow to bonds for the week.)

Exposures: The weekly data herein is important for the public asset managers with trends in mutual funds and ETFs impacting the companies with the following estimated revenue impact:
Jonathan Casteleyn, CFA, CMT
Joshua Steiner, CFA
