

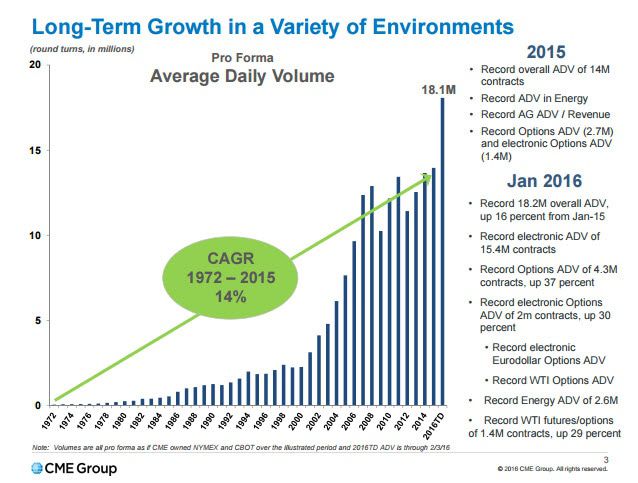
CME Group (CME), one of the few stocks that sits on our Best Ideas list as a long, put up a decent fourth quarter earnings print this morning with a slight revenue and earnings beat. Not that we put much weight on what happened last quarter but trends into the new operating period are looking even better. The exchange guided to just a +1% operating expense increase for 2016, guided to slightly lower annual taxes for '16 (with more activity coming from abroad), and again announced that open interest was setting a new record, this week at over 111 million contracts. January activity for the Merc is averaging 18.2 million contracts per day, up 16% year-over-year. Even assuming some mean reversion to just over 16.5 million contracts (depending on product group), 1Q is running at ~$1.20 per share in earnings, which means the Street will need to perk up its current $1.06 estimate. Simply put, this is one of the few growth stories in the current macro environment within Financials.
Weekly Activity Wrap Up
1Q16TD average daily volumes (ADVs) in cash equities and futures continued to rise this week. Cash equity volume for the week came in at 9.3 billion shares traded per day, bringing the 1Q16TD ADV to 9.3 billion, up +34% Y/Y. Futures activity at CME and ICE came in at 24.7 million contracts traded per day this week, bringing the 1Q16TD ADV to 24.1 million, up +21% Y/Y. Additionally, CME is currently at an all time high in open interest of 111.2 million contracts, which should push volume higher going forward. Options did not have as strong a week, coming in with 16.9 million contracts traded per day, bringing the 1Q16TD ADV down to 18.7 million, although that still registers +23% Y/Y growth.

U.S. Cash Equity Detail
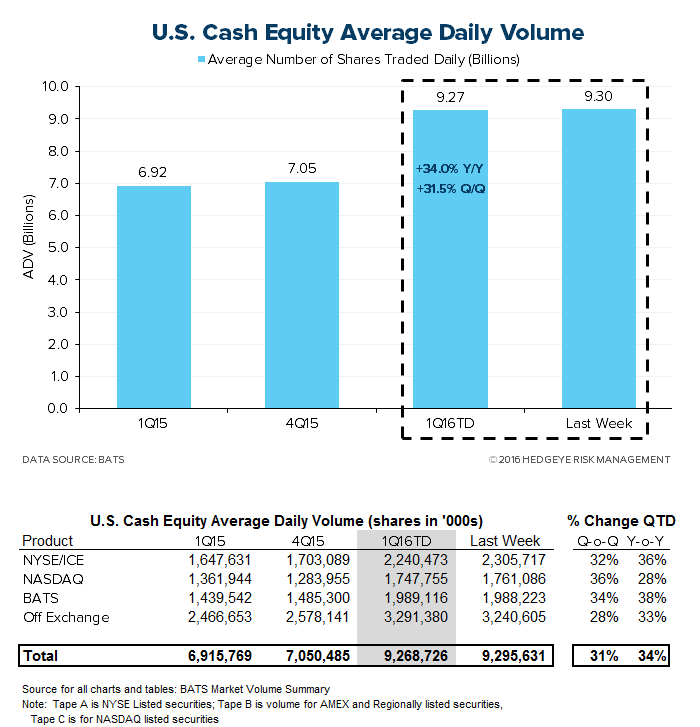
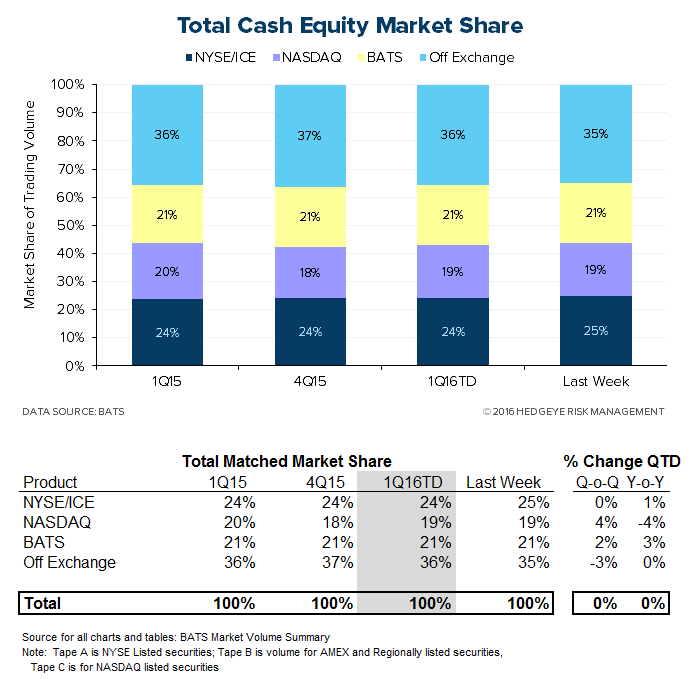
U.S. cash equities trading came in at 9.3 billion shares per day this week, bringing the 1Q16 average so far to 9.3 billion shares per day. That marks +34% Y/Y and +31% Q/Q growth. The market share battle for volume is mixed. The New York Stock Exchange/ICE is taking a 24% share of first-quarter volume, which is consistent with the prior quarter and year-ago quarter, while NASDAQ is taking a 19% share, +65 bps higher Q/Q but -84 bps lower than one year ago.
U.S. Options Detail
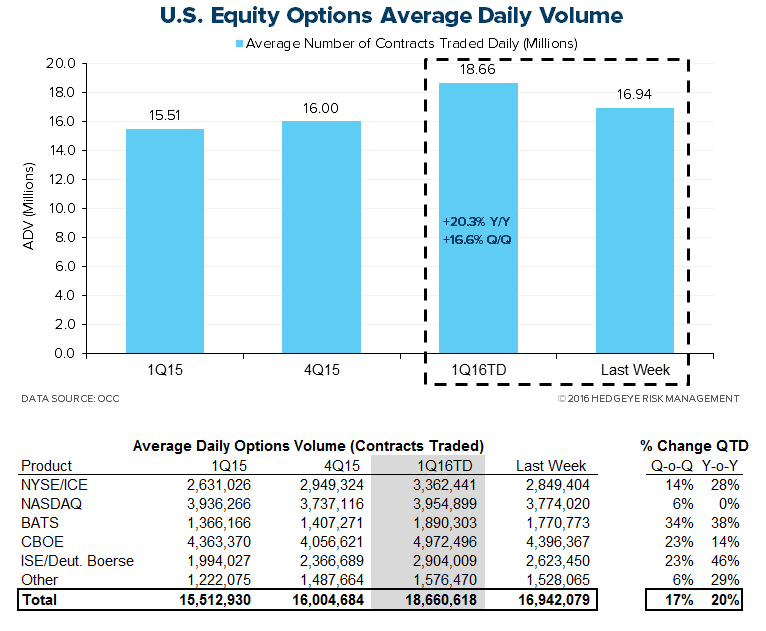
U.S. options activity came in at a 16.9 million ADV this week, bringing the 1Q16TD average to 18.7 million, a +20% Y/Y and +17% Q/Q expansion. In the market share battle amongst venues, NYSE/ICE has been trending downward at a moderate pace, but at an 18% share it is +106 bps higher than the year-ago quarter. Meanwhile, NASDAQ's recent declines bring it -418 bps lower than 1Q15. CBOE's market share is down -148 bps Y/Y but has improved recently; its 27% share of 1Q16TD volume is up +130 bps from 4Q15. BATS and ISE/Deutsche have been taking share from the competing exchanges, with BATS up to a 10% share from 9% a year ago and ISE/Deutsche taking 16%, up from 13% a year ago.

U.S. Futures Detail
17.9 million futures contracts traded through CME Group this week, bringing the 1Q16TD average to 18.1 million, a +21% Y/Y and +37% Q/Q expansion. Additionally, CME open interest, the most important beacon of forward activity, currently sits at an all-time high of 111.2 million CME contracts pending, good for +22% growth over the 91.3 million pending at the end of 4Q15, an improvement from last week's +17%.
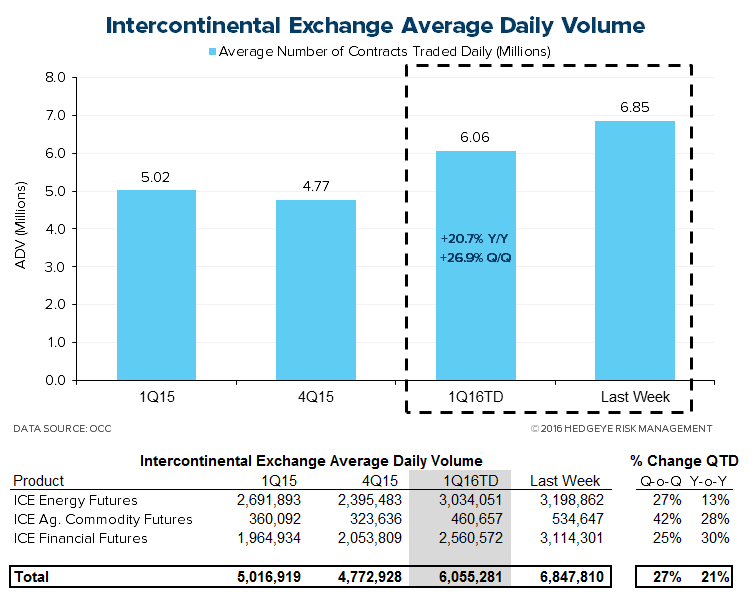
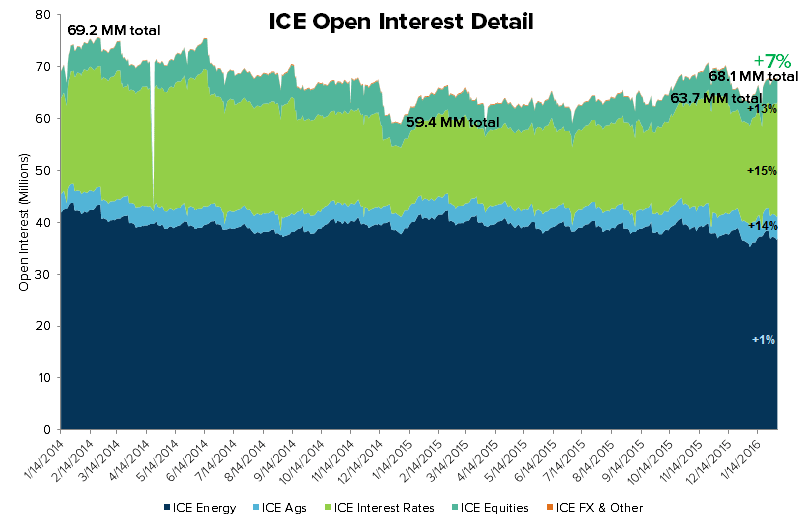
Contracts traded through ICE came in at 6.8 million per day this week, bringing the 1Q16TD ADV to 6.1 million, +21% Y/Y and +27% Q/Q growth. ICE open interest this week tallied 68.1 million contracts, a +7% expansion versus the 63.7 million contracts open at the end of 4Q15, an improvement from +5% last week.


Monthly Historical View
Monthly activity levels give a broader perspective of exchange based trends. As volatility levels, measured by the VIX, MOVE, and FX Vol should rise to normal levels after the drastic compression this cycle, we expect all marketplaces to experience higher activity levels.


Sector Revenue Exposure
The exchange sector has broadly diversified its revenue exposure over 10 years as public entities with varying top line sensitivity to the enclosed trading volume data. The table below highlights how trading volumes will flow through the various operating models at NASDAQ, CME Group, ICE, and Virtu:

Please let us know of any questions,
Jonathan Casteleyn, CFA, CMT
Joshua Steiner, CFA
