“If you don’t know who the sucker is, it’s you.”
-Unknown
Searching through QuoteInvestigator.com this morning (nice life at 5AM), I couldn’t figure out who actually made this common sense statement first. If you know, let me know!
In one of Berkshire’s Annual Reports, Warren Buffett wrote: “As they say in poker, if you’ve been in the game 30 minutes and don’t know who the patsy is, you’re the patsy.”
I don’t like the word patsy, and I don’t want to be the sucker. What I really want is good #process. As Lasse Heje Pedersen wrote in Efficiently Inefficient, “we are interested in strategies that can be expected to continue to make money in the future – a repeatable process that generates alpha.” (pg 39)

Back to the Global Macro Grind…
Don’t be the guy/gal who woke up this morning with the “15 Stocks To Buy Now” (cover of Barron’s this weekend). Instead of how to “position for a rebound” (Barron’s), non-suckers will continue to be positioned for what’s been working for 7 months – selling into the mother of all-time highs in US stocks, and ramping up defensive Long-term Treasury type (TLT) exposures.
Last week was a fun one, if only because they found “rebalance” as a reason to mark-up the US stock market into month end after a ridiculous move by the Japanese to target “negative yields” in their bond market. After closing +2.5% on the day on Friday (to get the SP500 +1.7% on the week), most macro pundits were able to forget that US GDP had a 0% handle on it (0.7% for Q4).
If you dig into the internals of the macro market moves (we’re non-sucker sticklers for breaking down the storytelling of it all) here’s how the weekly scores looked relative to 2016 to-date:
- US Dollar Index flat for the week and +1.0% YTD
- Burning Yen (vs. USD) -1.9% for the week and -0.7% YTD
- Nikkei (Japan) +3.3% for the week and -8.0% YTD
- Russell 2000 +1.4% for the week and -8.8% YTD
- Nasdaq only +0.5% on for the week and -7.9% YTD
- Healthcare Stocks (XLV) down -2.0% for the week and -7.7% YTD
I’ll stop there for a second as it’s critical to contextualize that the “QE hope” was all that was – a day trade. Many US “growth” investors aren’t long Japanese stocks or Commodity squeezes – they’re long Nasdaq and Healthcare beta.
If you break down the US Equity Style Factors week-over-week:
- High Short Interest Stocks were +2.8% for the week and are -6.0% YTD
- Low-Growth Stocks were +3.1% for the week and are -5.1% YTD
*Mean Performance of Top Quartile vs. Bottom Quartile of SP500 Companies
In other words, not only did Energy Stocks (XLE) +4.4% lead the low-quality-short-squeeze on Friday, but the Top Quartile of SP500 Sales Growers sucked, closing only +0.7% on the week and only -7.5% YTD.
If you can’t be long the “growth” that everyone is already long, what was up last week that is A) actually up YTD and B) generating non-sucker alpha for the right reasons?
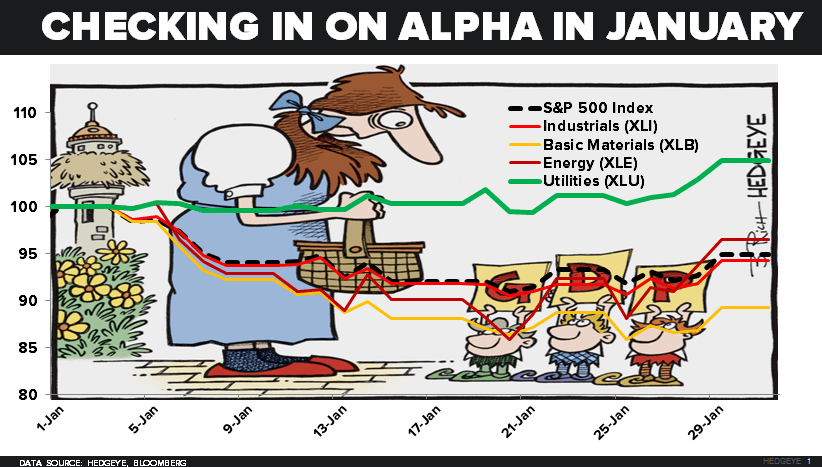
- Utilities (XLU) had another monster week, closing +3.7% to 4.9% YTD
- The Long Bond (TLT) capitalized on another -13 basis point drop in the 10yr Yield to get to +5.3% YTD
- Gold tacked on another +1.8% for the week, moving to +5.3% YTD
While US Dollar (UUP), The Long Bond (TLT), and Utilities (XLU) remain the Top 3 LONG Ideas in our Global Macro Themes Deck, I added Gold (GLD) to the long side (when it was red on the day) in Real-Time Alerts late last week.
On the other side of those Long Ideas, there’s a bounty of excellent short selling opportunities this morning in things like:
- Oil
- Copper
- CAT
- Canadian (and US) Banks
- SPY (SP500)
Oh yeah. You like that last one don’t you! SPY has been the sucker’s rally position for the aforementioned 7 months (when it locked in its all-time #Bubble high of 2130 in July of 2015).
Admittedly, being short SPY hasn’t been as sexy as short something like the Italian Stock Market (MIB Index DOWN another -2.0% last week to -12.9% YTD with #EuropeSlowing from its cycle peak), but it’s been pretty sexy.
From a sentiment perspective, looking at the CFTC non-commercial net SHORT position in the SP500 (Index + Emini):
- It got 54,976 LESS short last week to -137,478 net SHORT contracts
- That’s 50% less short than the peak short position established in SEP 2015 (at the market low)
- And that position registers a -0.5 z-score vs. its 1yr avg (the 6mth avg net SHORT position = -148, 831)
So, for starters, I’m thinking that the SP500 (SPY) has at least another 200 handles of intermediate-term TREND downside (another -10% from Friday’s marked-up close) before I take a knee again. Consensus on a US #Recession isn’t nearly Bearish Enough.
Our immediate-term Global Macro Risk Ranges are now:
UST 10yr Yield 1.91-2.02%
SPX 1
RUT
YEN 119.01-121.54
Oil (WTI) 27.52-34.66
Gold 1100-1132
Best of luck out there this week,
KM
Keith R. McCullough
Chief Executive Officer