

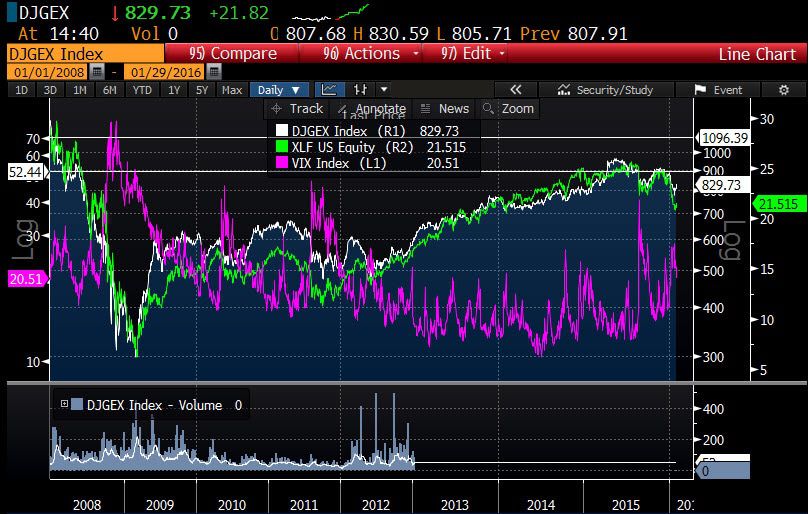
The exchange stocks historically have acted as shock absorbers in high volatility environments kicking off relative outperformance against the broader financial sector. The calm of 2012 through mid-2014, put the exchanges at just inline performers versus the XLF as both baskets of financial stocks rose in lock-step. However the high VIX environment of 2009-2011 displayed the worth of these techology driven, agency mechanisms, as the Dow Jones Exchange Index (DJGEX) consistently outperformed the Financials sector SPDR. With the VIX (magenta line, left scale) again breaking out of its base with higher highs and higher lows entering 2016, we expect the start of a divergence between the DJGEX and the XLF to continue. Only at very high levels of VIX (north of 40) do exchange equities also get shaken out to lower levels historically.
Weekly Activity Wrap Up
With volatility easing, exchange traded volume slacked off this week, although the week's average daily volumes (ADVs) in cash equities and futures still exceeded their year-over-year comps. Cash equity volume came in at 8.6 billion shares traded per day this week, bringing the 1Q16TD ADV to 9.3 billion, up +34% Y/Y. Futures activity at CME and ICE came in at 21.5 million contracts traded per day this week, bringing the 1Q16TD ADV to 24.0 million, up +20% Y/Y. CME in particular is setting an all-time trading volume high with 18.1 million contracts per day on average this month, taking out the former high of 17.5 million in ADV in October 2014 on the potential for a Greek exit from the European Union. Options did not have as strong a week, coming in with 15.3 million contracts traded per day, but that still brings the 1Q16TD ADV to 19.1 million, up +23% Y/Y.

U.S. Cash Equity Detail
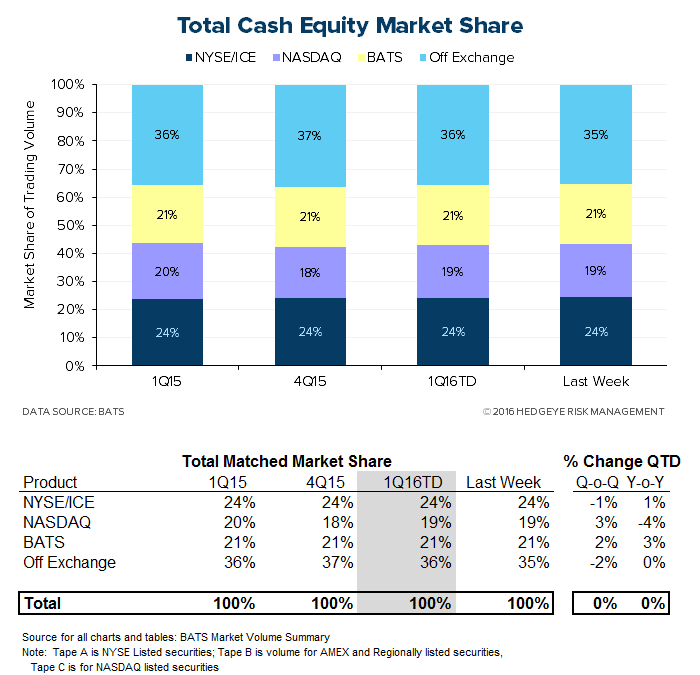
U.S. cash equities trading came in at 8.6 billion shares per day this week, bringing the 1Q16 average so far to 9.3 billion shares per day. That marks +34% Y/Y and +31% Q/Q growth. The market share battle for volume is mixed. The New York Stock Exchange/ICE is taking a 24% share of first-quarter volume, which is consistent with the prior quarter and year-ago quarter, while NASDAQ is taking a 19% share, +62 bps higher Q/Q but -86 bps lower than one year ago.

U.S. Options Detail
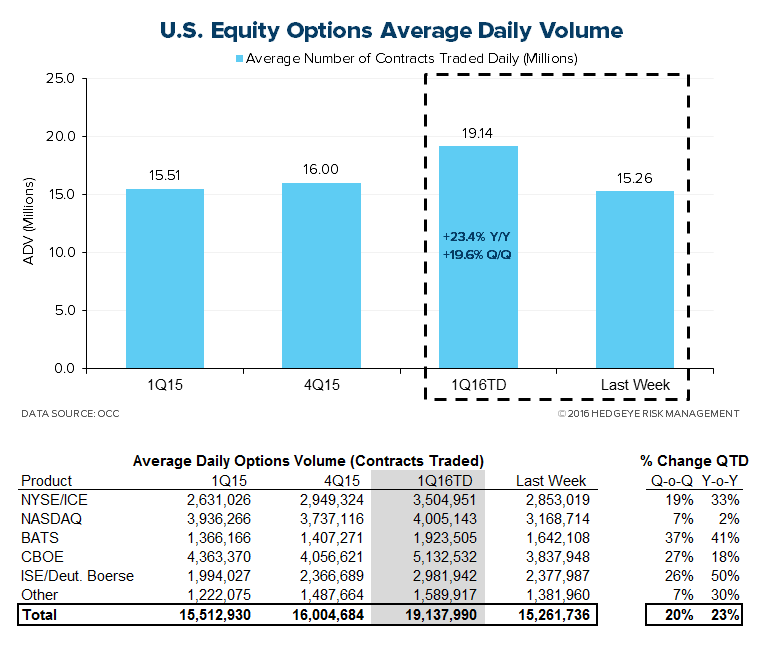
U.S. options activity came in at a 15.3 million ADV this week, bringing the 1Q16TD average to 19.1 million, a +23% Y/Y and +20% Q/Q expansion. In the market share battle amongst venues, NYSE/ICE has been trending downward at a moderate pace, but at an 18% share it is +135 bps higher than the year-ago quarter. Meanwhile, NASDAQ's recent declines bring it -445 bps lower than 1Q15. CBOE's market share is down -131 bps Y/Y but has improved recently; its 27% share of 1Q16TD volume is up +147 bps from 4Q15. BATS and ISE/Deutsche have been taking share from the competing exchanges, with BATS up to a 10% share from 9% a year ago and ISE/Deutsche taking 16%, up from 13% a year ago.

U.S. Futures Detail
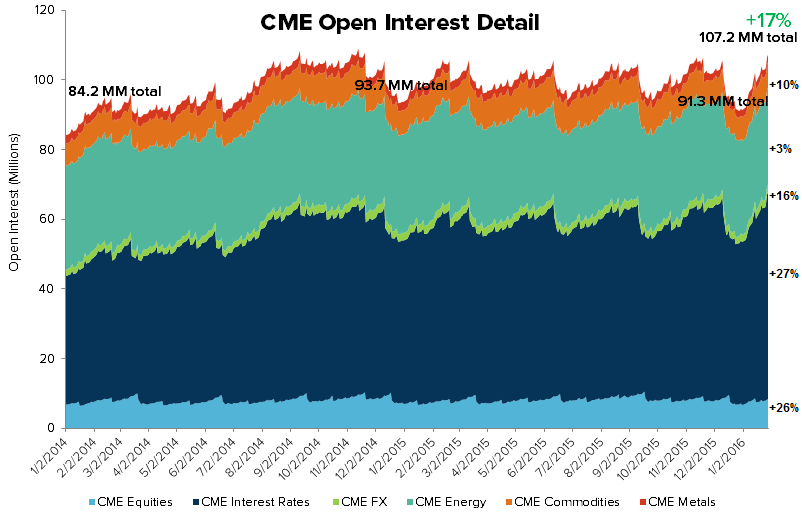
15.5 million futures contracts traded through CME Group this week, bringing the 1Q16TD average to 18.1 million, a +21% Y/Y and +37% Q/Q expansion. CME open interest, the most important beacon of forward activity, currently tallies 107.2 million CME contracts pending, good for +17% growth over the 91.3 million pending at the end of 4Q15, an improvement from last week's +14%.
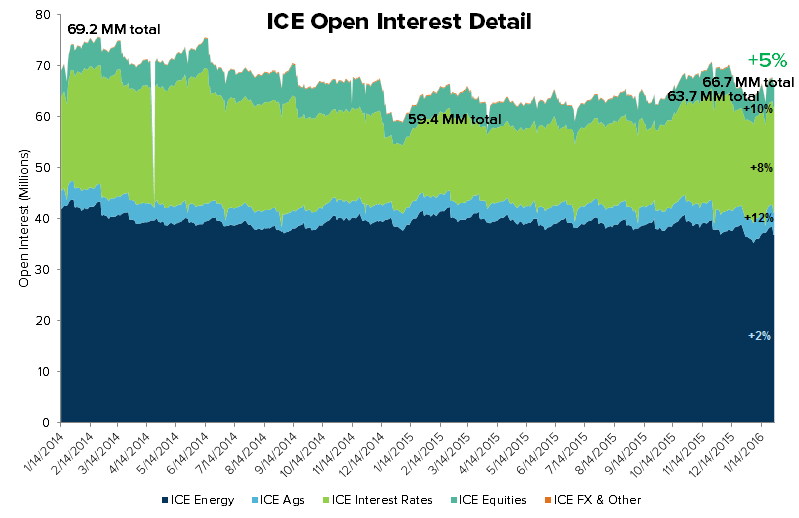
Contracts traded through ICE came in at 6.0 million per day this week, bringing the 1Q16TD ADV to 5.8 million, +17% Y/Y and +22% Q/Q growth. ICE open interest this week tallied 66.7 million contracts, a +5% expansion versus the 63.7 million contracts open at the end of 4Q15, consistent with last week.


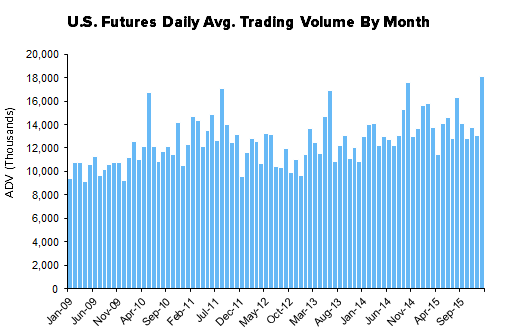
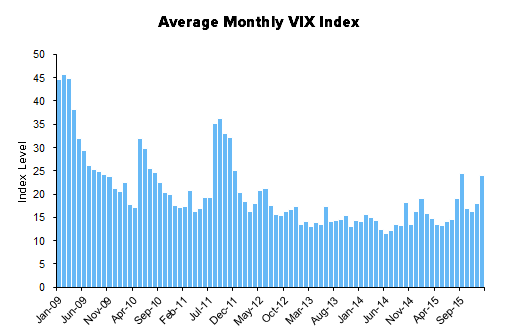
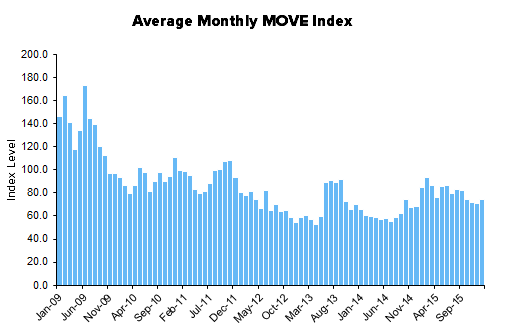
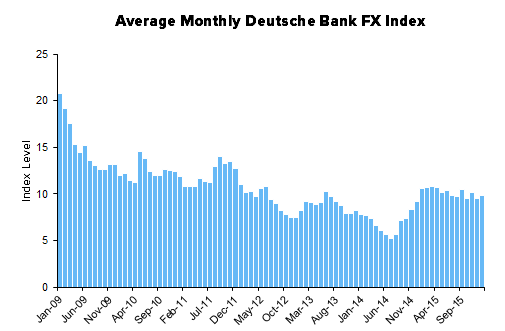
Monthly Historical View
Monthly activity levels give a broader perspective of exchange based trends. As volatility levels, measured by the VIX, MOVE, and FX Vol should rise to normal levels after the drastic compression this cycle, we expect all marketplaces to experience higher activity levels.


Sector Revenue Exposure
The exchange sector has broadly diversified its revenue exposure over 10 years as public entities with varying top line sensitivity to the enclosed trading volume data. The table below highlights how trading volumes will flow through the various operating models at NASDAQ, CME Group, ICE, and Virtu:

Please let us know of any questions,
Jonathan Casteleyn, CFA, CMT
Joshua Steiner, CFA
