Below is the breakdown of this morning's labor data from Joshua Steiner and the Hedgeye Financials team. If you would like to setup a call with Josh or Jonathan or trial their research, please contact

Seasonally adjusted initial claims rose 10k on the week to 293k, while the 4-wk moving average rose 6.5k to 285k. That's the highest level for the 4-wk rolling average since April of last year. Broadly, the trend in claims has been 2 steps backward, 1 step forward since the low of 259k were recorded on October 24th last year.
Yes, initial claims are still very low by historical standards at sub-300k, but given the emergent weakness in a host of economic data series (Industrial Production, Chicago PMI as examples), the prudent question to ask is not whether labor is still good or bad in absolute terms, but whether it's getting better or worse on the margin. In that context, the trend of rising initial unemployment insurance claims that is now 3 months old is definitely disconcerting.
As a reminder, we are coming up on the 23rd month of a sub-330k claims environment. The last three cylces saw claims remain below 330k for 24, 45 and 31 months (33 months on average) before the economy entered recession. That puts us 10 months from the average, 1 month from the min and 22 months from the max. The cycle is converging with the end of its historical timeline.
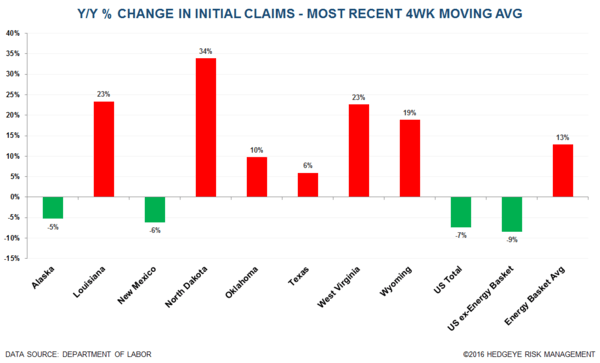
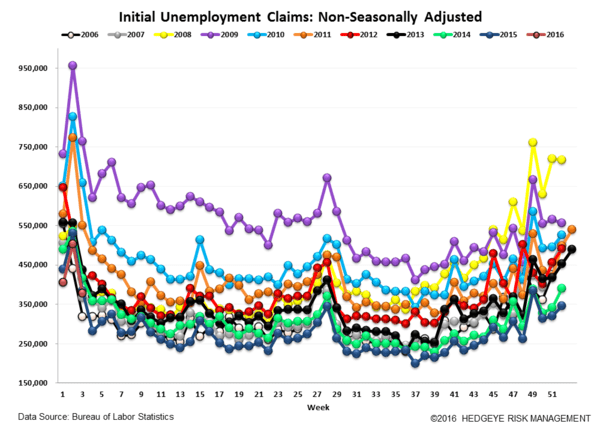
Meanwhile, energy states continue to feel the effects of falling commodity prices. As we show in the 3 charts below, the labor market decoupling between energy states and non-energy states continues


The Data
Prior to revision, initial jobless claims rose 9k to 293k from 284k WoW, as the prior week's number was revised down by -1k to 283k.
The headline (unrevised) number shows claims were higher by 10k WoW. Meanwhile, the 4-week rolling average of seasonally-adjusted claims rose 6.5k WoW to 285k.
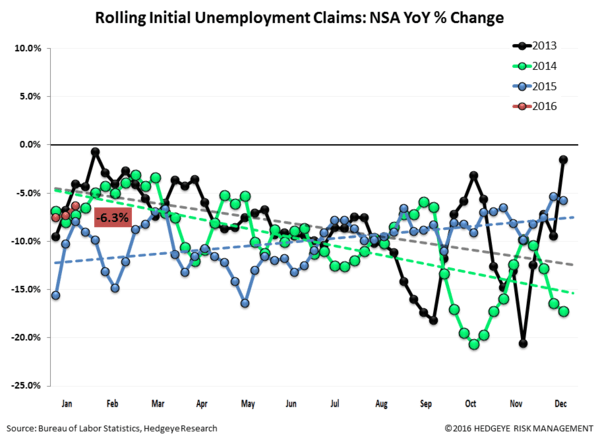
The 4-week rolling average of NSA claims, another way of evaluating the data, was -6.3% lower YoY, which is a sequential deterioration versus the previous week's YoY change of -7.4%


Joshua Steiner, CFA
Jonathan Casteleyn, CFA, CMT