Editor's Note: Want a better understanding of why our macro team thinks the likelihood of a U.S. #Recession in Q2 or Q3 of 2016 is significant? Wall Street is completely missing this. It has to do with the relationship between labor income and corporate profitability.
See below a brief excerpt from a research note written by our U.S. Macro analyst Christian Drake explaining this relationship. To learn more about how you can subscribe to our institutional research email sales@hedgeye.com.
... And click here to join us on The Macro Show today with Hedgeye CEO Keith McCullough. It's free.
According to Drake:
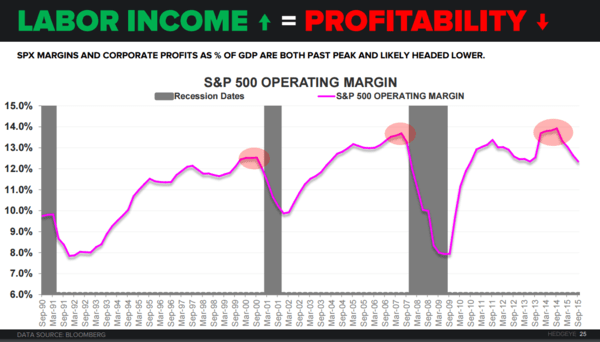
Labor Income ↑ = Profitability ↓
With labor rising, topline (GDP & Corporate Profit estimates) decelerating and inventories spiking (see the recent wholesale inventory data), the probability that positive hiring perpetuates continued margin contraction is more likely than not.
Take a closer look at the charts below.