
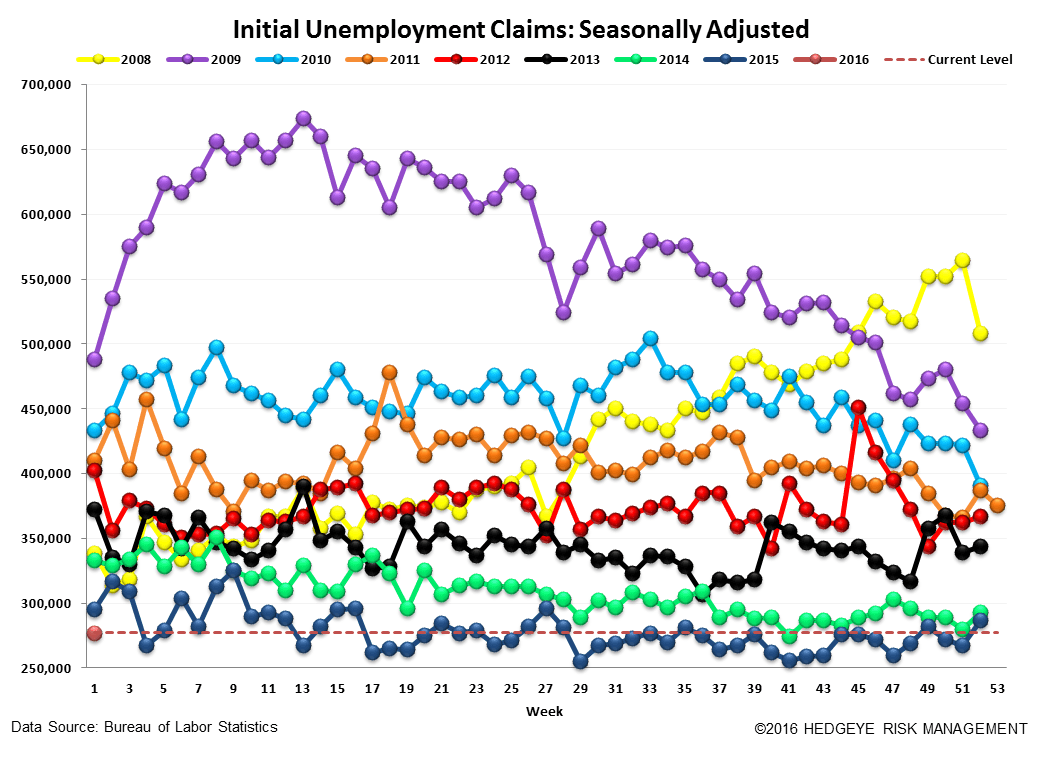
This week's headline claims number offered a brief intermission from the data's upward trend. Seasonally adjusted claims fell 10k to 277k, and the 4-week rolling average backed off by a nominal 1k from its 5-month high of 277k to 276k.
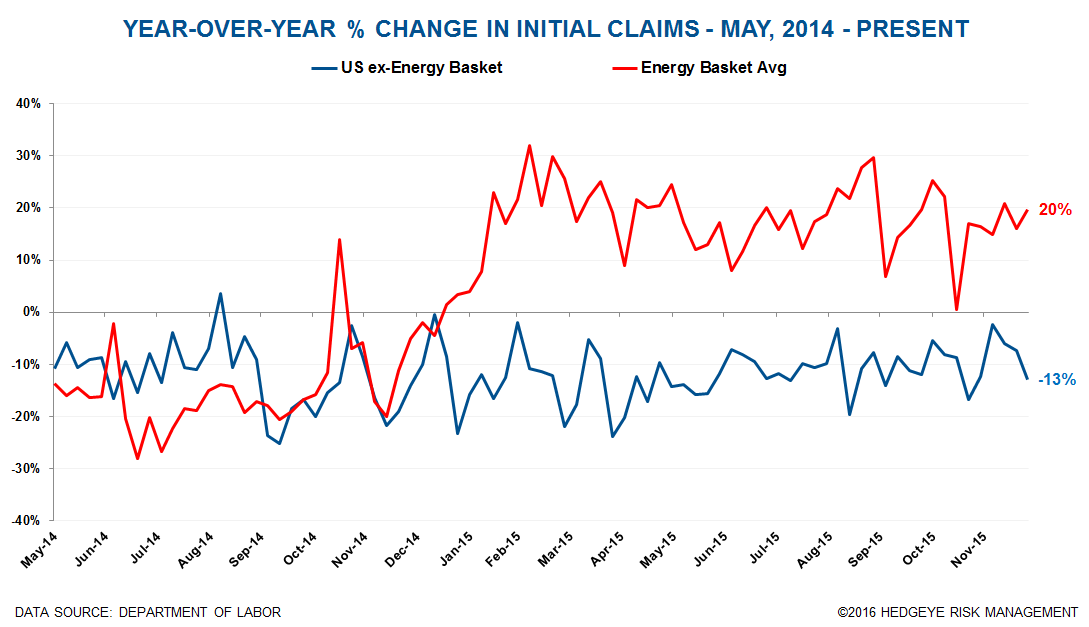
The three charts below illustrate the challenges/pain in the energy sector. The first chart shows the Y/Y RoC in initial claims across the eight energy-heavy states, the US, the US excluding these eight states and the average change for those eight states. Of the eight states highlited, six are showing initial claims growing Y/Y. The fastest growth is in Louisiana, where claims are higher by 53% Y/Y. The second fastest growth is in Texas, where claims are higher by 36% Y/Y. Interestingly, all eight energy states are performing worse the country as a whole.
The second chart shows Y/Y RoC in initial claims since May 2014 for the US ex-Energy States and for the Energy State basket. The breakout in energy state claims began at the start of 2015 and has remained steadily decoupled since.


The Data
Initial jobless claims fell 10k to 277k from 287k WoW. The prior week's number was not revised. Meanwhile, the 4-week rolling average of seasonally-adjusted claims fell -1.25k WoW to 275.75k.
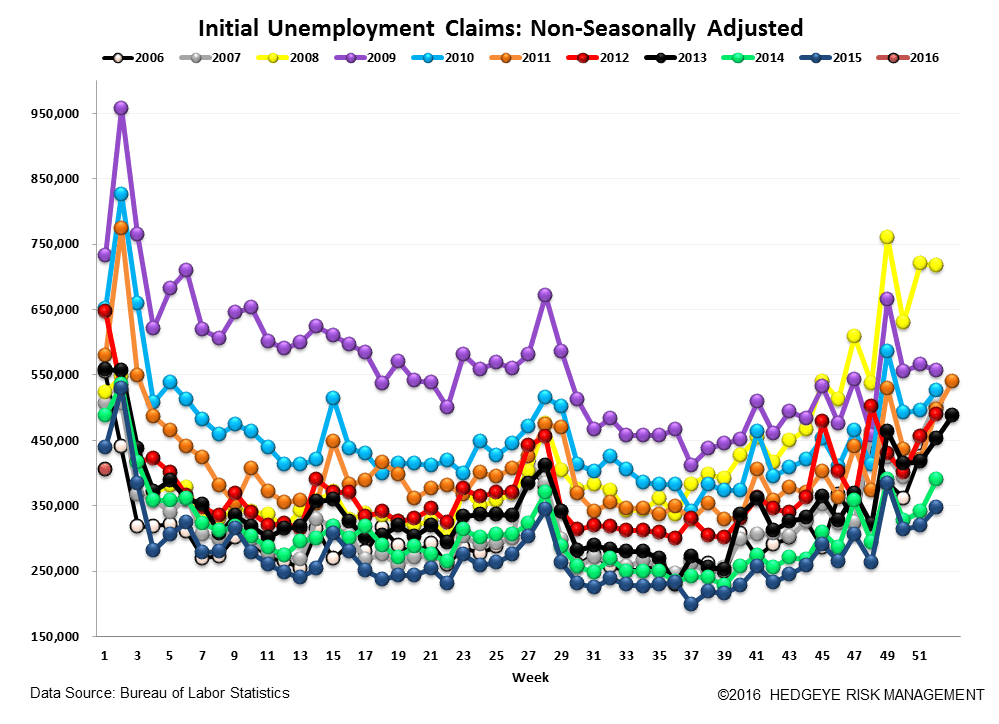
The 4-week rolling average of NSA claims, another way of evaluating the data, was -7.6% lower YoY, which is a sequential improvement versus the previous week's YoY change of -5.8%.


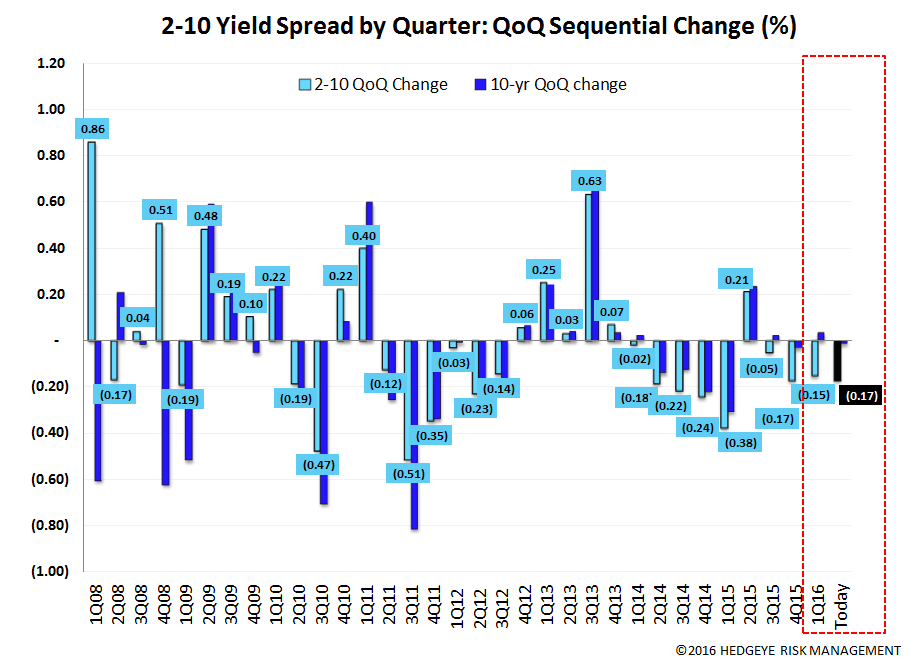
Yield Spreads
The 2-10 spread fell -3 basis points WoW to 119 bps. 1Q16TD, the 2-10 spread is averaging 121 bps, which is lower by -15 bps relative to 4Q15.

Joshua Steiner, CFA
Jonathan Casteleyn, CFA, CMT