CHART OF THE DAY: This Indicator (Always) Signals 20%+ Stock Market Crash

01/07/16 08:08AM EST

Editor's Note: Below is a brief excerpt and chart from today's Early Look written by Hedgeye U.S. Macro analyst Christian Drake. Click here to learn more. 

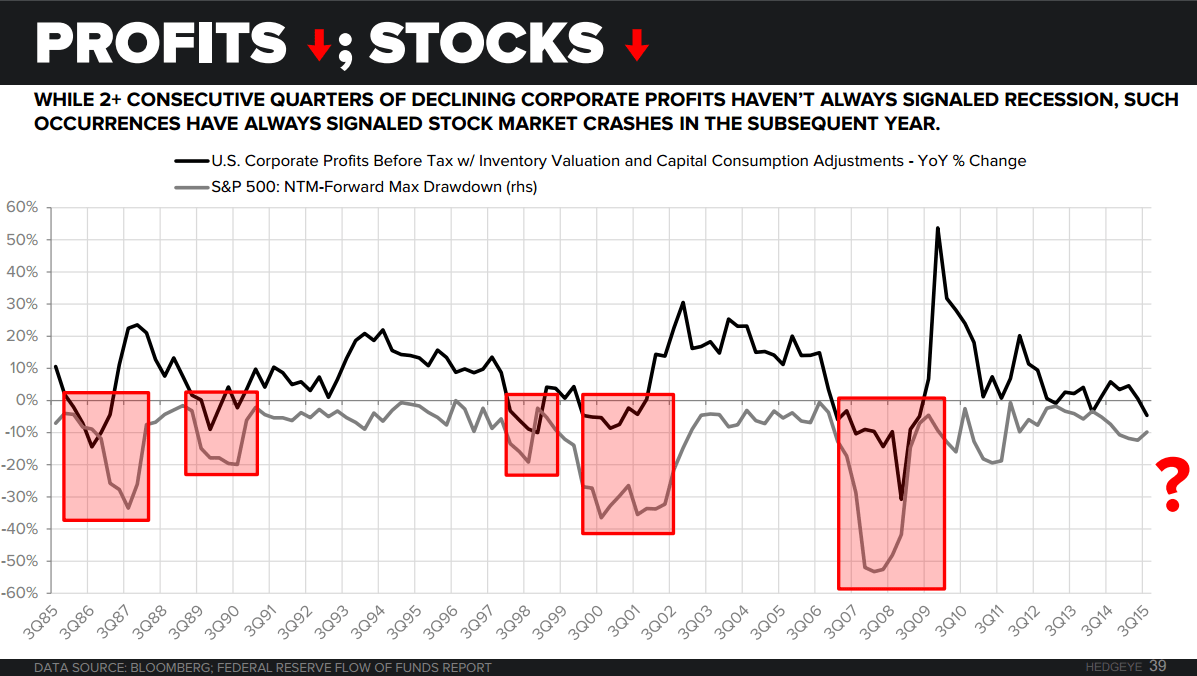
"... In the Chart of the Day below we show corporate profit growth vs forward year returns in the S&P500. 


The takeaway is straightforward:  While 2+ consecutive quarters of declining corporate profits haven’t always signaled recession, such occurrences have always signaled stock market crashes in the subsequent year."

CHART OF THE DAY: This Indicator (Always) Signals 20%+ Stock Market Crash - EL profits

© 2024 Hedgeye Risk Management, LLC. The information contained herein is the property of Hedgeye, which reserves all rights thereto. Redistribution of any part of this information is prohibited without the express written consent of Hedgeye. Hedgeye is not responsible for any errors in or omissions to this information, or for any consequences that may result from the use of this information.