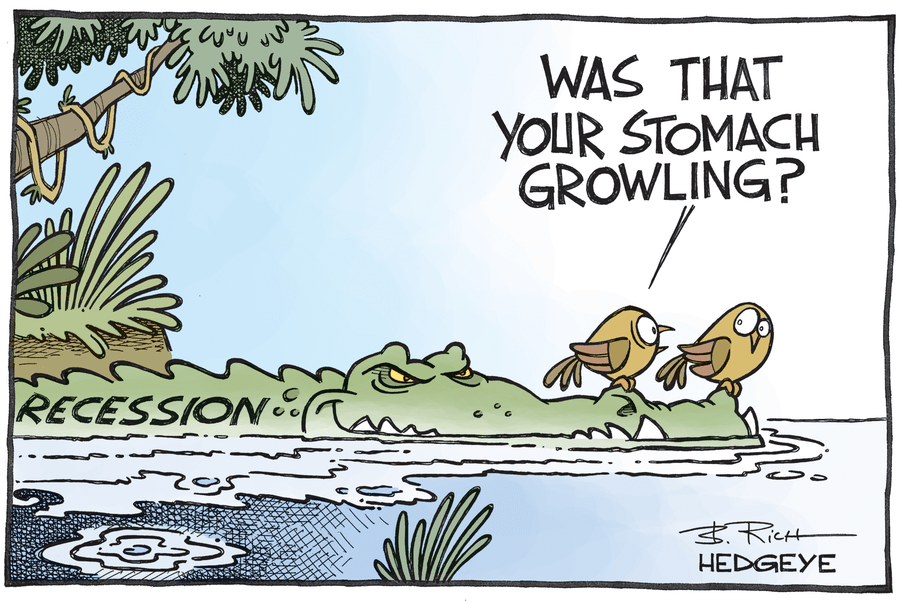
We've been warning for a while now about the coming recession which we anticipate may arrive in the second quarter of this year. Below are three charts laying out our thesis and a fourth explaining why, even if we're wrong on that recession, the US stock market is probably going to crash anyway...
1. A past peak profit cycle...
"Once a peak in the S&P 500 breaks below its twelve month trailing average, look what happens. It rolls off and it goes down really fast," Hedgeye CEO Keith McCullough said on The Macro Show.

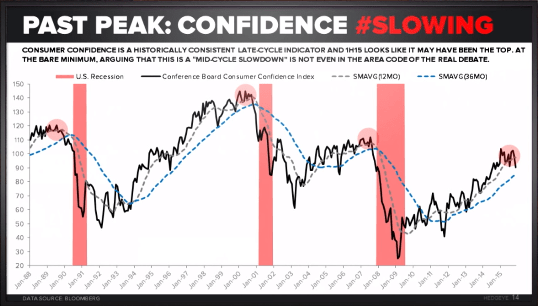
2. Consumer Confidence breaking off its cycle high...
"People aren't confident right now. As you can see, in the cycle, it's an elevator on the way up and windows on the way down," McCullough said.
3. the end of declining jobless claims...
"Jobless claims always peak at 600,000 and bottom at 300,000 at the end of the cycle. In the next six months you're right where you're at in the prior three recessions," McCullough said.

For good measure, here's one of McCullough's favorite slides from this week's 73-page Q1 Macro Themes presentation explaining why U.S. stocks are headed for a crash regardless of what happens with our recession call. (To get access to our Macro team's entire presentation ping sales@hedgeye.com.)
https://twitter.com/KeithMcCullough/status/684832097085845505