

Our Hedgeye Housing Compendium table (below) aspires to present the state of the housing market in a visually-friendly format that takes about 30 seconds to consume.

Today’s Focus: November Pending Home Sales & October Case-Shiller
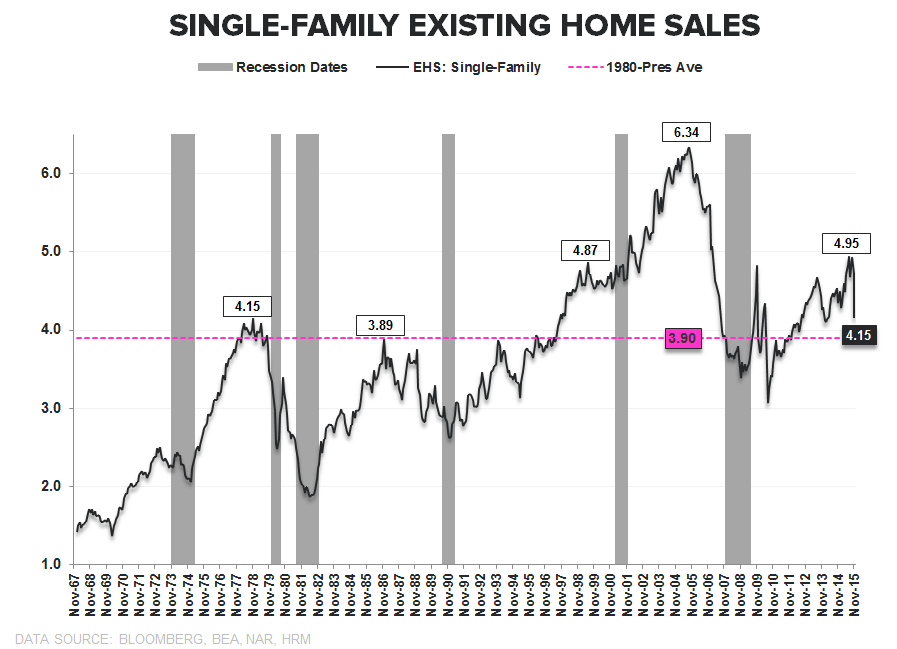
Pending Home Sales declined -0.9% in November against upwardly revised October estimates while accelerating +110bps sequentially to +5.1% YoY (NSA). While year-over-year growth accelerated against modestly easier comps (a dynamic that should persist next month), total signed contract activity recorded a 6th month of retreat off the May 2015 cycle peak.
Perhaps the obvious question is whether May did, indeed, reflect the peak in activity in the current cycle. From a rate-of-change perspective, sales growth in the existing market is very likely past peak – growth in 2015 benefited from both easy comps and mean reversion upside as demand in 2014 was down significantly and total sales volumes still had upside back to long-term historical averages. Both of those dynamics are now rearview.
While construction in the New Home market continues to hold significant upside to normalized levels of activity, on an absolute basis, higher highs in sales volumes in the existing market will require further normalization in entry level demand and some measure of supply-side support. Growth in first-time buyer demand has been growing +12.2% YTD and we’d need to see a similar pace of demand recovery continue out of that cohort (along with ~static investor demand) to drive EHS back above 6.0MM Units.
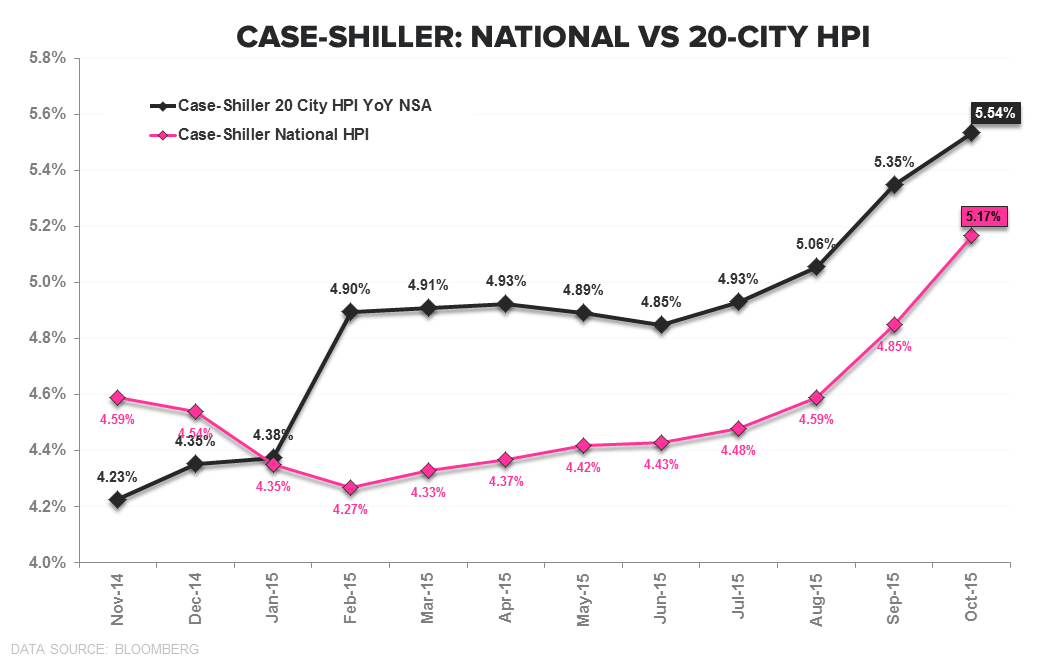
On the pricing side, the Case-Shiller HPI data for October released yesterday confirmed the multi-month acceleration trend observed across all three primary price indices (CoreLogic, FHFA, Case-Shiller). Tight Supply and Trailing demand trends should continue to support HPI over the nearer term and serve as a modest tailwind for housing related equities. Price-Supply-Demand dynamics in the existing market remain delicate as rising prices help to improve the position of underwater and low-equity owners (with positive flow through to supply) while further challenging affordability for marginal buyers on housing’s bottom rung.


About Pending Home Sales:
The Pending Home Sales Index is a monthly data release from the National Association of Realtors (NAR) and is considered a leading indicator for housing activity in the US. It is a leading indicator for Existing Home Sales, not New Home Sales. A pending home sale reflects the signing of a contract, but not the closing of the transaction, which occurs 1-2 months later. The NAR uses data from the MLS and large brokers to calculate the Pending Home Sales index. An index value of 100 corresponds to the average level of activity during 2001.
Frequency:
The NAR Pending Home Sales index is released between the 25th and the 31st of each month and covers data from the prior month.
About Case Shiller:
The S&P/Case-Shiller Home Price Index measures the changes in value of residential real estate by tracking single-family home re-sales in 20 metropolitan areas across the US. The index uses purchase price information obtained from county assessor and recorder offices. The Case-Shiller indexes are value-weighted, meaning price trends for more expensive homes have greater influence on estimated price changes than other homes. It is vital to note that the index’s printed number is a 3-month rolling average released on a two month delay.
Frequency and Release Date:
The S&P/Case-Shiller HPI is released on the last Tuesday of every month. The index is on a two month lag and therefore does not reflect the most recent month’s home prices.
Joshua Steiner, CFA
Christian B. Drake
