

Our Hedgeye Housing Compendium table (below) aspires to present the state of the housing market in a visually-friendly format that takes about 30 seconds to consume.
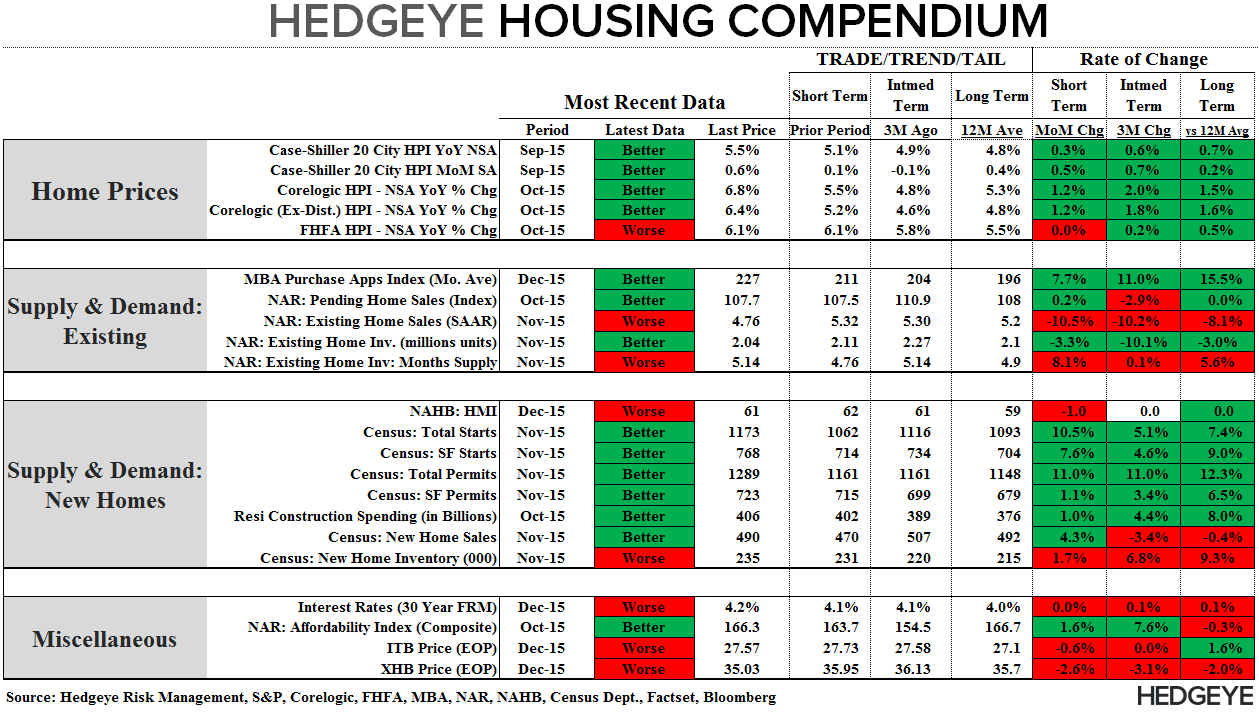
Today’s Focus: New Home Sales for November & MBA Purchase Apps
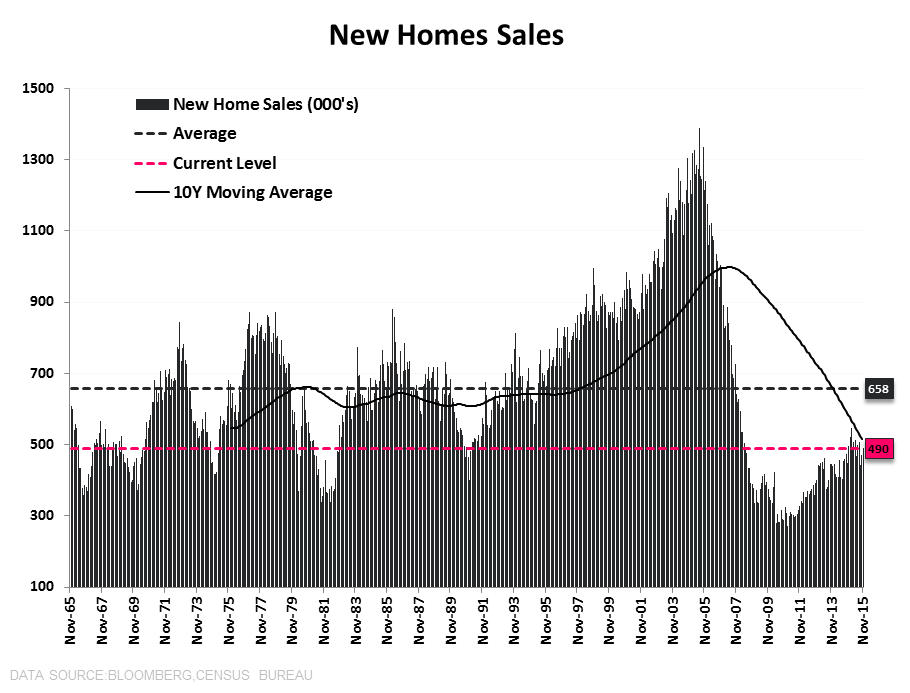
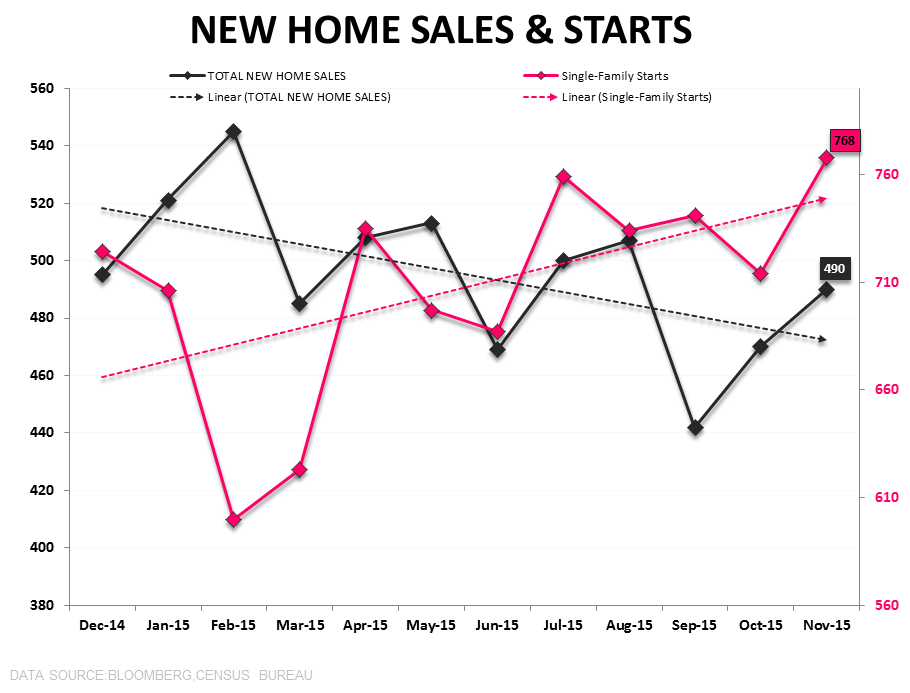
New Home Sales: New Home Sales rose +4.3% to 490K in November against downwardly revised October estimates. On a year-over-year basis, sales were up +9.1% with accelerating growth in the South and West offsetting declining growth in the Northeast and Midwest.
Given the serial tendency toward downward revision and a +/-18% margin of error, NHS are one of the most volatile and highly revised housing data series, making it hard to take an overly convicted view of any given month in isolation. Any TRID related impacts in the November data only adds to the noisiness.
From a Trend perspective, the gain in November brings sales activity in the New Home Market (currently running at ~9.3% of the total housing transaction volume) back up to the TTM average with Sales growth YTD running +13.9% YoY relative to the corresponding period last year.
In short, the November NHS data is largely trend consistent and with total and single-family starts making higher cycle highs in November, the mean reversion march higher in new construction activity and sales remains modestly choppy but ongoing.
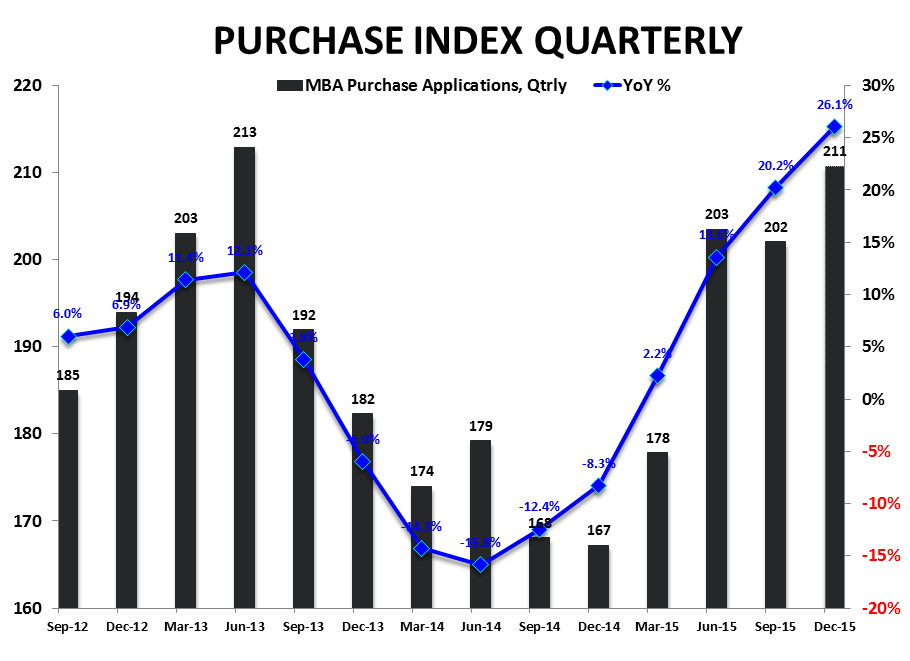
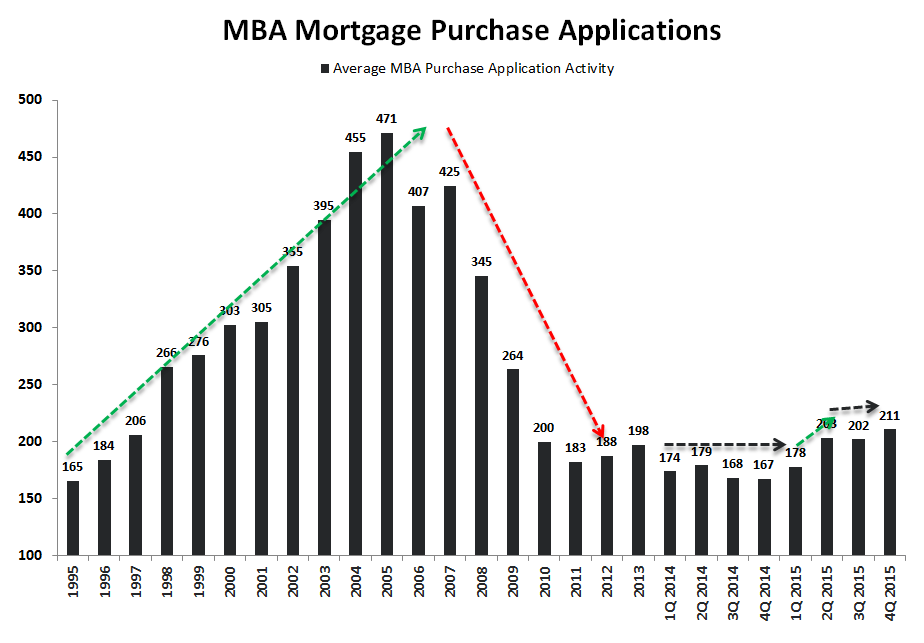
Purchase Applications: Purchase Demand rose +4.10% sequentially and accelerated to +37.6% YoY, taking the Index reading to 230.8 – marking the fastest pace of growth YTD and the highest index reading since mid-2010. The strength in latest weeks extends the streak of elevated activity observed in the back half of November/December to-date to six weeks. Seasonal and peri-holiday noise in the high frequency data is prevalent this time of year but the persistent strength observed over the last month and a half lends some legitimacy to the reported uptick in purchase demand. We’ll look for confirmatory evidence out of Pending Home Sales data for November due out next Wednesday.
It’s also worth noting that continued housing market normalization with further recovery in conventional mortgaged purchases and a decline in distressed/cash/investor sales would be expected to manifest in a drift higher in purchase application activity but with less than a one-for-one flow through to total transaction volume.


About New Home Sales:
Each month the Census Department releases the New Home Sales report, which measures the number of newly constructed homes that have been sold in the month. The difference between the New Home Sales report and the Starts and Permits report is that New Home Sales only includes single family spec homes built and sold by builders, and does not include condos, apartments, or owner-built units. This is why New Home Sales typically run at roughly half the rate of Starts.
About MBA Mortgage Applications:
The Mortgage Bankers’ Association’s mortgage applications index covers more than 75% of mortgage applications originated through retail and consumer direct channels. It does not include loans delivered through wholesale broker and correspondent channels. The MBA mortgage purchase applications index is considered a leading indicator of single-family home sales and construction. Moreover, it is the only housing index that is released on a weekly basis.
Frequency:
The MBA Purchase Apps index is released every Wednesday morning at 7 am EST.
Joshua Steiner, CFA
Christian B. Drake
