“With us flying is not an experiment; it is a demonstration.”
-Wilbur Wright
Chapter 9 of what I think is one of the best non-fiction books of the year, The Wright Brothers, by David McCullough, is called “The Crash.” What I like most about this amazing story of American innovation is the obsession and objectivity of the #process:
“People think I am foolish because I do not like men to do the least important work on the machine. They say I crawl under the machine when the men could do the thing well enough. I do it partly because it gives me opportunity to see if anything in the neighborhood is out of order.”
-Wilbur Wright (pg 195)
As we move into the final weeks of 2015, it’s still very obvious that the Federal Reserve’s grand experiment has generated forecasts that are very much out of order. Both market prices and their commensurate volatilities demonstrated that again during last week’s “rate hike.”

Back to the Global Macro Grind…
Trying to “demonstrate strength” by raising interest rates into a slow-down revealed the #1 weakness of the macro market last week. It’s called #Deflation. No, it’s not “transitory.” It’s been pervasive.
Here’s how that looked in #StrongDollar terms:
- US Dollar Index +1.2% on the week to +9.3% YTD
- Canadian Dollar -1.3% on the week to -16.6% YTD
- Brazilian Real -2.7% on the week to -33.4% YTD
- CRB Commodities Index -1.5% on the week to -25.1% YTD
- Oil (WTI) -3.0% on the week to -42.4% YTD
- Copper -0.4% on the week to -25.5% YTD
And that’s just a small but impactful snapshot of what is happening underneath the hood of the Global Macro market’s machine. Whether you’re a Brazilian farmer or a Canadian miner, you get it. Yep. That’s “ex-Energy.”
If you have friends who still aren’t yet aware of modern day macro and how experimental central-plannings impact Foreign Currencies, Commodities, and Credit markets, please send them a Hedgeye Macro subscription for Christmas!
With the SP500 dropping -3.3% in the 2 days following the Fed’s experiment, this is what happened from an Equity Sector Style perspective:
- Basic Material Stocks (XLB) -3.8% on the week
- Energy Stocks (XLE) -2.8% on the week
- Utilities (XLU) +1.7% on the week
Yep. Same signal. When the USD ramps and rates fall, Utilities rally and #Deflation (Energy and Basic Materials) continues.
This macro reality continues to get priced into the non-Energy Style Factors of the US stock market:
- HIGH BETA stocks dropped another -2.0% last week to -15.3% YTD
- SMALL CAP stocks deflated another -1.5% last week to -15.9% YTD
- HIGH DEBT stocks dropped another -0.7% last week to -13.8% YTD
*mean performance of Top Quartile vs. Bottom Quartile (SP500)
And from a Sales and Earnings perspective (SP500 companies):
- SALES: bottom 25% Sales Growers fell another -1.4% last week to -15.5% YTD
- EARNINGS: bottom 25% Earnings Growers deflated another -1.0% to -15.7% YTD
That’s why stock pickers finally agree that #GrowthSlowing is as good a macro call as #Deflation has been. In a slowing growth environment, companies that are growing are getting more expensive. Meanwhile “cheap” companies that miss numbers continue to get cheaper.
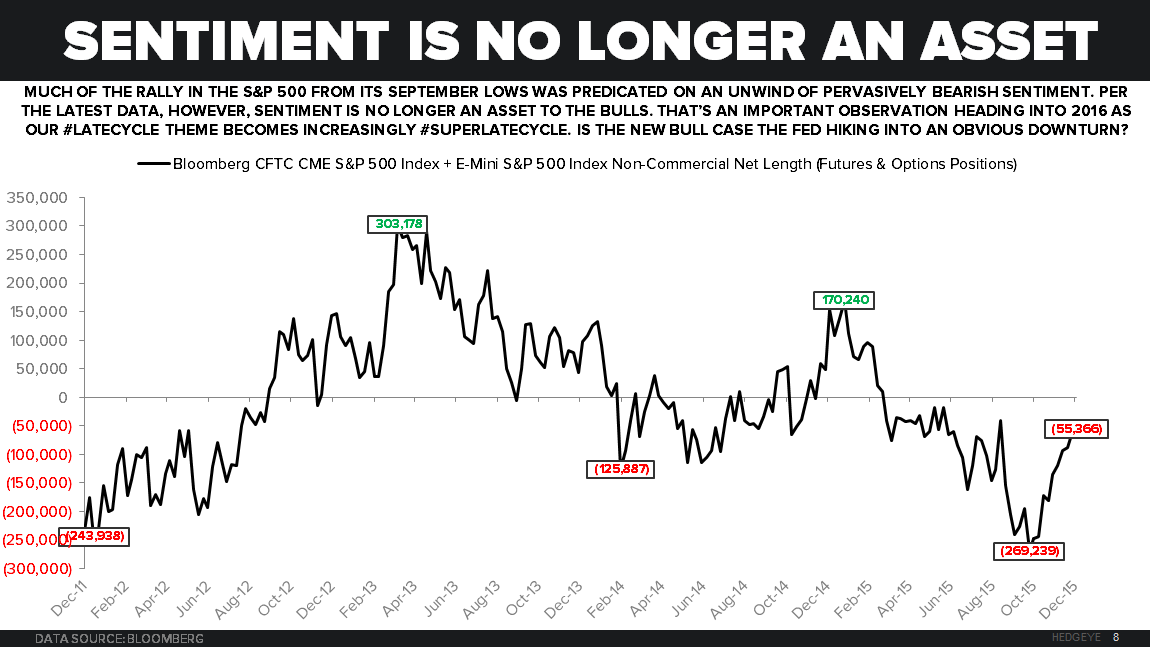
Finally, since some of the perma bulls are now saying that everything they missed is “priced in”, here’s what sentiment looks like from a net positioning perspective (CFTC non-commercial futures and options):
- SP500 (Index + Emini) net SHORT position just closed at its LOWEST level in 3 months (-55,366 net short contracts)
- US Dollar net LONG position just came in at its LOWEST level this month (+36,858 net long contracts)
To put both of those positions in context, the 3-month average net SHORT position in SP500 is -160,851 and the 3-month average net LONG position in US Dollars is +41,879.
Maybe that’s why Mr. Market demonstrated that the Long USD and Short SPY position didn’t crash last week. The Fed’s credibility did.
Our immediate-term Global Macro Risk Ranges are now:
UST 10yr Yield 2.12-2.32%
SPX 1
RUT 1104--1157
VIX 17.84-24.83
USD 97.68-99.41
Oil (WTI) 34.24-37.98
Best of luck out there this week,
KM
Keith R. McCullough
Chief Executive Officer