Weekly and Activity and Quarter-End Wrap Up
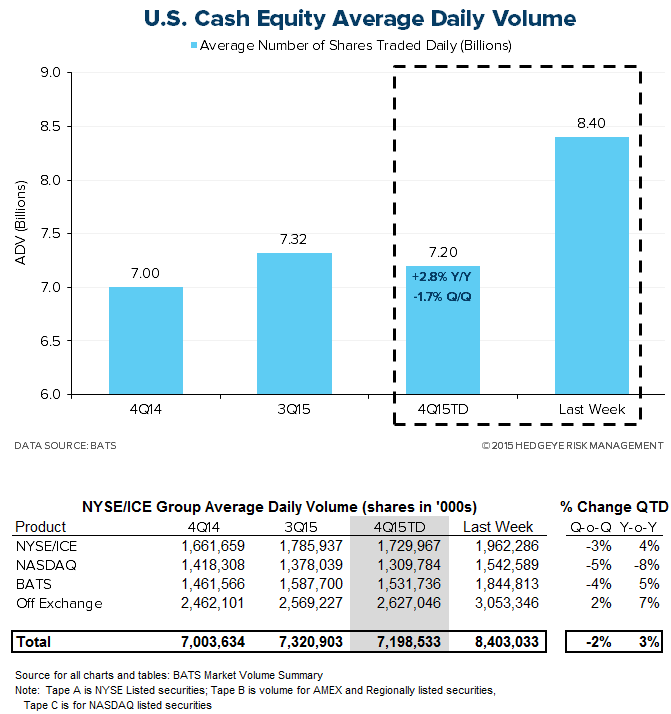
All three categories had their most active week of the quarter given trading around the Fed's rate hike and oil hitting new lows. Cash equity volume came in at 8.4 billion shares traded per day, bringing the 4Q15TD ADV up to 7.2 billion, which is +3% higher than 4Q14. Throughout 4Q15, equities' ADV growth over 4Q14 has, for the most part, stayed within a range of flat to +3%.
Futures activity (both on CME and ICE) came in at 24.5 million contracts per day in the most recent 5 days, blending the 4Q15TD ADV to 19.2 million, now +3% higher than the previous quarter and in line with the year-ago quarter. Y/Y comps were difficult for futures this quarter given extraordinary activity levels in 4Q14 stimulated by the threat of a Grexit from the Eurozone. Futures' ADV growth over 4Q14 started the quarter out negative and hit a low of -12% in the period ending October 22. However, volume steadily rose over the course of 4Q15 to the point where it is now in line with 4Q14.
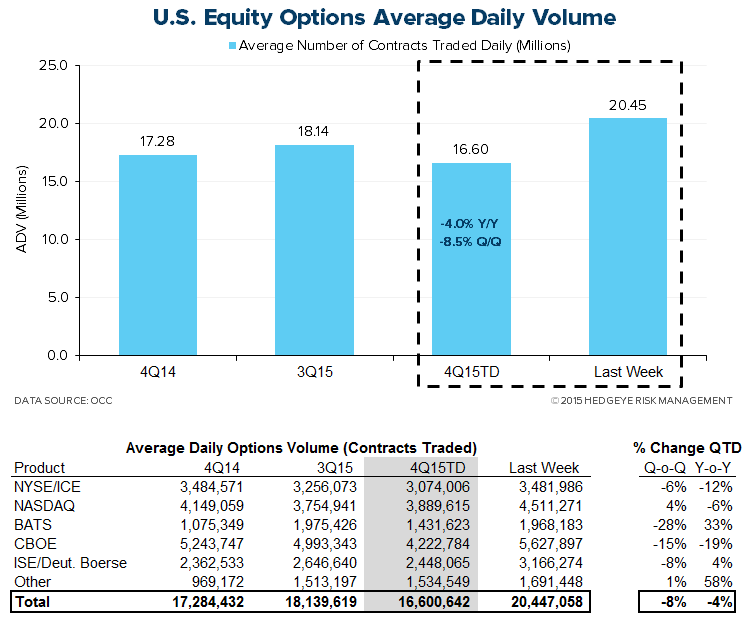
Options put up an average of 20.4 million contracts per day this week, blending the quarter-to-date daily average to 16.6 million, -4% lower Y/Y and -8% lower Q/Q. Options ADV growth over 4Q14 was consistently negative throughout 4Q15, usually maintaining a range between -2% and -6%.

U.S. Cash Equity Detail
U.S. cash equities trading came in at 8.4 billion shares per day this week. That brings the fourth quarter average to 7.2 billion shares traded per day, a +3% Y/Y growth and -2% Q/Q contraction. The market share battle for volume is mixed. The New York Stock Exchange/ICE is taking a 24% share of fourth-quarter volume, a +1% year-over-year increase, while NASDAQ is taking an 18% share, a -10% year-over-year decline.

U.S. Options Detail
U.S. options activity came in at a 20.4 million ADV this week, bringing the 4Q15TD average to 16.6 million, a -4% Y/Y and -8% Q/Q contraction. The market share battle amongst venues continues to be one of losses at the NYSE/ICE, which has lost -8% of its share year-over-year settling at 19% of options trading currently. Additionally, CBOE's market share sits at 25%, -16% lower than 4Q14. NASDAQ's share of 4Q15 volume has been falling slightly in the past few weeks, bringing it -2% lower than 4Q14. However, at 23%, the exchange's market share is still +13% higher than the previous quarter. Additionally, BATS' 9% share of 4Q15TD volume is +39% higher than in 4Q14. Finally ISE/Deutsche's 15% share in 4Q15TD remains consistent with 3Q15, which brings it to +8% Y/Y growth.

U.S. Futures Detail
CME Group activity came in at 18.0 million contracts traded per day, bringing the 4Q15TD average to 14.1 million, a -5% Y/Y and -2% Q/Q contraction. Y/Y comps were difficult this quarter with ADV growth over 4Q14 hitting a low of -17% in the period ending October 22. However, volume grew steadily thereafter to the point where CME's 4Q15TD ADV is now only -5% below that difficult 4Q14 comp. CME open interest fell to 95.7 million CME contracts pending this week as investors redeemed their December exposures to roll them into January.
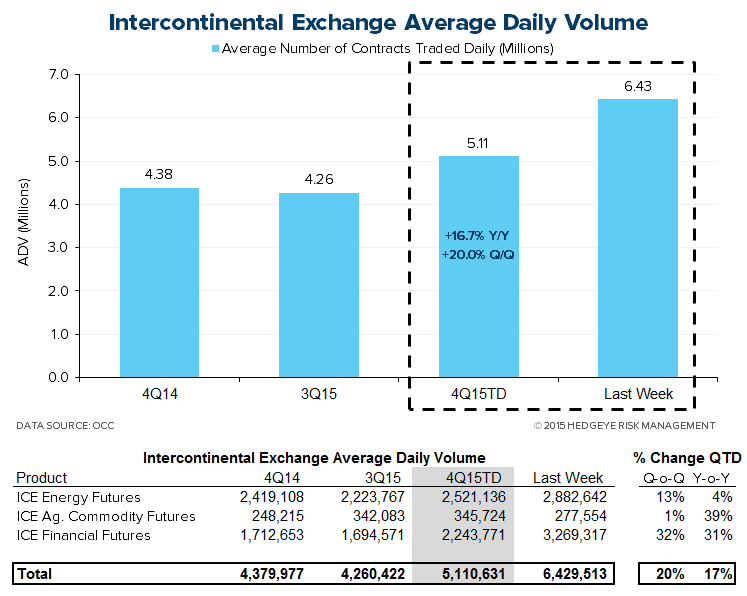
ICE activity came in at 6.4 million contracts traded per day this week, bringing 4Q15TD ADV to 5.1 million, +17% Y/Y and +20% Q/Q growth. Over 4Q15, Similarly to CME, ICE's QTD ADV dipped down to a low in the week ending October 22. However, Y/Y growth at that point was still significantly positive at +7%. Since then, the QTD ADV has risen to it's current +17% Y/Y growth. Also similarly to CME, ICE open interest this week fell to 66.6 million contracts pending as investors rolled their exposures into January.


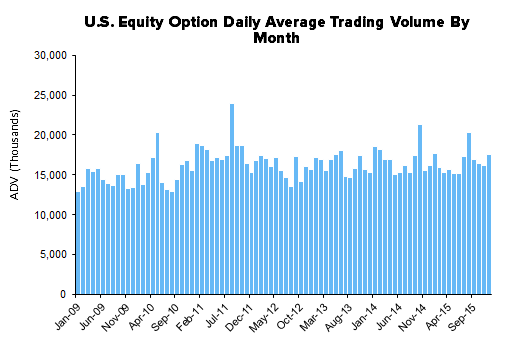
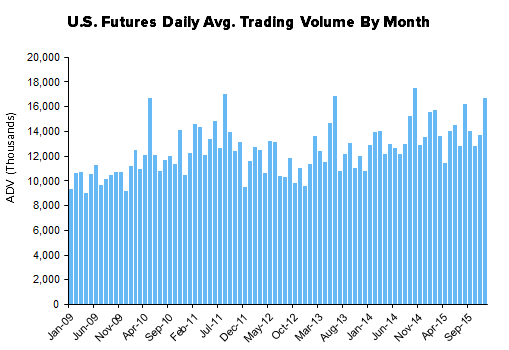
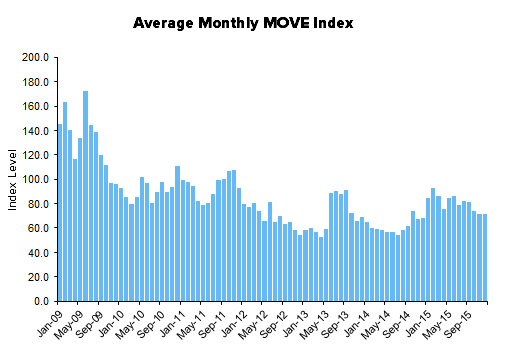
Monthly Historical View
Monthly activity levels give a broader perspective of exchange based trends. As volatility levels, measured by the VIX, MOVE, and FX Vol should rise to normal levels after the drastic compression this cycle, we expect all marketplaces to experience higher activity levels.


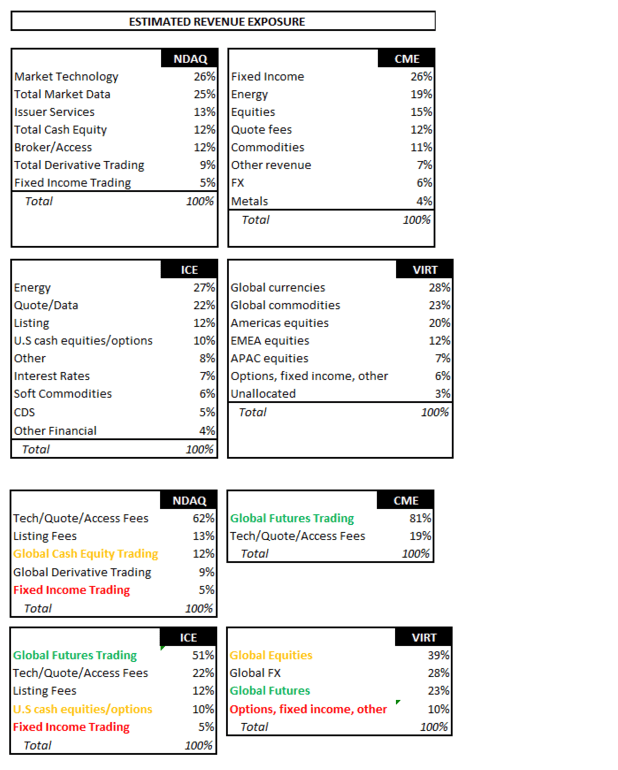
Sector Revenue Exposure
The exchange sector has broadly diversified its revenue exposure over 10 years as public entities with varying top line sensitivity to the enclosed trading volume data. The table below highlights how trading volumes will flow through the various operating models at NASDAQ, CME Group, ICE, and Virtu:
Please let us know of any questions,
Jonathan Casteleyn, CFA, CMT
Joshua Steiner, CFA