“Never memorize something that you can look up.”
-Albert Einstein
Looking back, one of the most impactful professional epiphanies I had as a young analyst was not pretending to know stuff.
The propensity to feign understanding is pervasive – even in meetings and discussions with smart institutional investors.
Information turnover (in the brain) is an individual specific but inescapable reality - especially if you have kids, too little sleep, too much caffeine and interests outside of starring at numbers inside of small rectangles all day.
I don’t know a lot of stuff and I’ve forgotten and relearned dozens of things dozens of times. In truth, if it’s not something I’ve been particularly focused on over the last month or so, I’ve probably forgotten a lot of the technical specifics.
Maybe it’s just me, but I suspect not.
Here’s the deal: If our experience and particular investment specialty isn’t uniquely aligned, then give me the 3-minute, 5th grade level intro of whatever it is we’re talking about then get into the technical meat. That way the next 45 minutes of meeting won’t be a complete waste of time with us both pretending we know what the other is talking about.
Sure, superficially we’ll kind of get the salient points but scattered and incomplete intuition doesn’t make a thesis click together like some investment alpha Rubik’s Cube without first leveling the field and establishing a baseline level of context for the discussion.
Not knowing things shouldn’t be closeted as a terminal vulnerability.
2016 - less pretense purveying, more common sense mongering.
Back to the Global Macro Grind ….
In the spirit of that intro, this morning I’d like to do a little didactic exploration of 3 topics.
- Yield Spread Compression
- Earnings Management
- Raising Rates | The How
This morning’s note is a little longer than usual, so feel free to jump around and/or pick your own Macro adventure below.
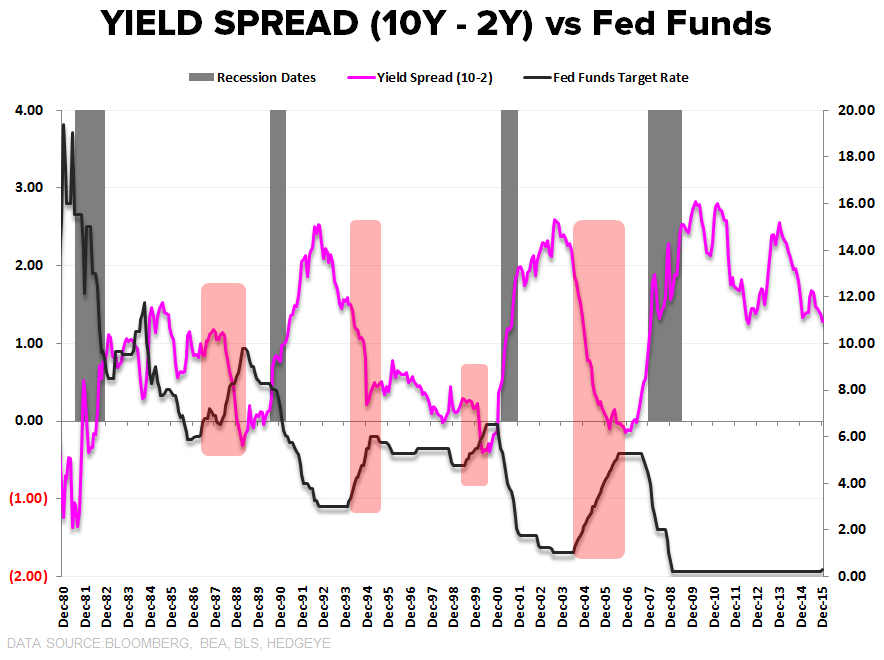
Yield Spread Compression: As the chart above illustrates, the yield spread plots as a cyclical function, flattening as the economy slows with policy driving the short-end higher and defensive positioning and/or discounting of lower future growth/inflation driving the long end lower.
Yesterday we had Dollar ↑, Rates ↓, and XLU (Utilities) the lone green sector as the yield spread compressed another -5 bps.
That cross-asset class, price action cocktail is about as conspicuous a deflationary macro signal as there is with strong dollar deflationary forces perpetuating bond market expectations of slower-and-lower-for-longer on both growth and inflation.
The steady compression in the yield curve back down to 7-year lows yesterday is what fancy market types affectionately call a #BearFlattening.
How many tightenings does it take to get to the deflationary center of a global macro pop. The world may soon know (HERE if you don’t get it).
Earnings management: Last week some academics from Cambridge & California published an analysis on the prevalence of earnings manipulation among public companies HERE.
Unsurprisingly they did, indeed, find it to be prevalent. Further, they found the capacity for a given company to manage EPS and manufacture a string of positive earnings surprises lasts roughly two years and the motivation for it evolves over time.
- In the beginning, it’s designed to drive management compensation (ties to earnings growth or share-price targets) and multiple expansion
- Towards the end, it functions to simply prop up elevated valuation
The implications are relatively straightforward: At the end of an earnings management cycle (which also tends to correspond to the end of a market/eco cycle), you have both artificially inflated EPS and overvaluation. This dynamic makes the late-cycle meeting with reality all the more epic as both earnings and multiples contract simultaneously – compounding the price impact.
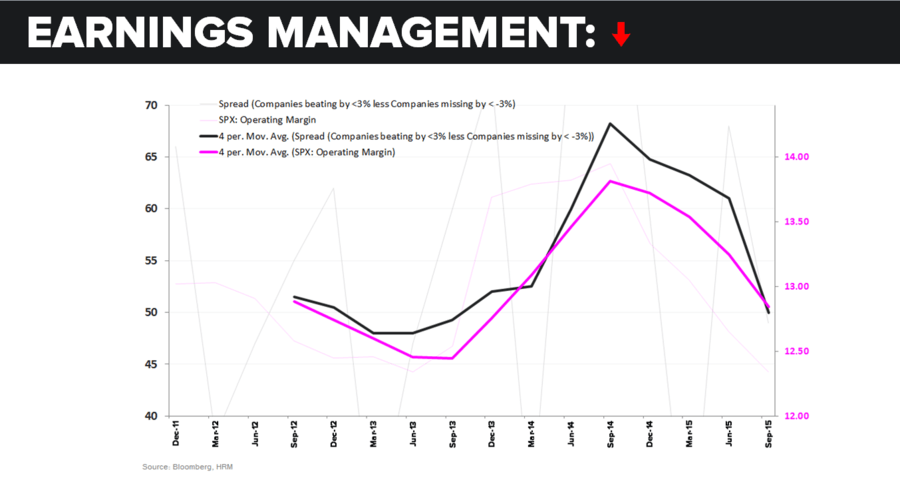
In the Chart of the Day below we show the spread between the # of companies beating by <3% and the # of companies missing by < -3% (black line) vs. S&P500 Operating Margin (pink line).
In the absence of earnings management and/or systematic analyst error, you’d expect equal dispersion around the zero-line with the # of companies beating and missing by a small amount to be roughly equal.
But it’s not:
- The spread is always positive – the number of companies barely beating is always higher than the number barely missing, suggesting a little “messaging” of the numbers.
- The spread correlates well with the trend in margins: when margins are expanding, the levers or capacity for earnings management is higher. The converse holds true as well.
The simple takeaway is that with corporate profitability now past peak and margins contracting, the capacity for manufactured beats is lower and declining. With repo activity down some 75% in 3Q, that management lever is now apparently past peak as well.
Policy Implementation | The How: This has been pretty well covered in recent weeks but in talking with people yesterday, more people than not still seem to not know, mechanically, how the Fed plans to manufacture higher rates.
Here’s the layman summary:
- Fed Funds Market | Traditionally: The Fed sets the policy rate via intervention in the Fed Funds market (where banks lend to each other overnight). Traditionally, activity in the Fed Funds market was dominated by domestic banks with smaller participation from the federal home loan banks (who they are isn’t particularly important here).
- Fed Funds Market | Post-Crisis: Banks have trillions in excess reserves and don’t need to borrow in the Fed Funds market, leaving the home loan banks as the primary participants.
- Interest Rates on Excess Reserves (IOER): In the post-crisis period, banks can park excess reserves at the Fed and earn the IOER (was +0.25%, now 0.50%), the federal home loan banks cannot - so they are left participating/looking for yield in the Fed Funds market
What’s Been happening Post-Crisis: Banks borrow from the remaining participants in the Fed Funds market (those who are ineligible to park excess cash at the Fed at the IOER rate). They lend to banks at a rate below the IOER and the banks then arbitrage the difference and earn the spread between the market Fed Funds rate and the IOER.
In this setup, the Reverse Repo Rate (was ~0.05%) = the floor in rates and the IOER represents the ceiling (note: the “Reverse Repo” rate sounds very sophisticated but all it refers to is the rate at which the Fed borrows money overnight – Company X gives the Fed dollars overnight in exchange for a bond from the Fed, and the Fed pays them interest on it. The interest rate the Fed pays is the reverse repo rate.)
In other words, non-bank participants can either lend at the RRP rate to the Fed or lend to banks at something above that but below the IOER (which they are ineligible to receive).
So that’s the setup. How, mechanically, will they march rates higher:
- IOER: The Fed raised the IOER from 0.25% to 0.50% …. Again Raising the IOER effectively creates the ceiling on the interest rate corridor – same as before.
- RRP: The Fed raised the reverse repo rate from 0.05% to 0.25%, allowing money market funds and participants in the fed funds market to earn the 0.25% yield being offered by the RRR. Again, this effectively creates the floor - why lend at less if you can earn that yield from the Fed.
The Hope: Because market participants can now earn the rate offered on the RRP (0.25%) from the Fed they aren’t incentivized to lend below that rate. The arbitrage opportunity for the banks that existed before (borrow somewhere above the RRP rate and park at Fed at the IOER rate) still exists, it’s just stair-stepped higher. The hope is that the effective rate will fall between the RRP (0.25%) and the IOER (0.50%) … so, if the RRP rate = 0.25% and IOER rate = 0.50%, the Fed hopes the effective rate will fall somewhere around 0.35% - which is exactly where it was on post-liftoff day 1.
Viola, higher rates.
So, now you know. And as everyone knows, knowing is 1/2 the battle. The other 1\2, of course, is good 80’s cartoon references.
Our immediate-term Global Macro Risk Ranges are now:
UST 10yr Yield 2.12-2.32%
SPX 2003-2060
VIX 17.67-24.87
USD 98.22-99.76
Oil (WTI) 34.13-38.29
Best of luck out there today,
Christian B. Drake
U.S. Macro Analyst
Click Image to enlarge