Our Hedgeye Housing Compendium table (below) aspires to present the state of the housing market in a visually-friendly format that takes about 30 seconds to consume.

Today's Focus: December NAHB HMI (Builder Confidence Survey)
THE DATA: Builder Confidence dropped -1pt in December to an index level of 61 as all regions and all survey indicators declined modestly and labor and lot costs again headlined builder concerns. The decline in December marks a 2nd month of retreat off the cycle high reading of 65 recorded in October.
Across the sub-indices, Current Sales fell -1pt to 66 while Current Traffic and 6M Expectations declined -2pts to index readings of 46 and 67, respectively.
Geographically, the South was flat sequentially while the West (76) and Northeast (49) declined –1pt and the Midwest lost -5pts.
HMI & RATES | CYCLE CONTEXT: Yield Spread compression (10Y-2Y) has characterized every post-war tightening cycle with curve flattening discounting lower future growth/inflation. Mortgage Yield spread compression has displayed a similar pattern although curve flattening has stemmed largely from the rise in the short end outpacing the concomitant shift higher in 30Y mortgage rates.
All else equal, higher rates = ↓ affordability = ↓ pricing power for builders. Empirically, across cycles, builder confidence is negatively correlated with rates with inflections in builder confidence and housing/builder performance occurring alongside changes in the policy rate and flow through shifts in mortgage financing costs.
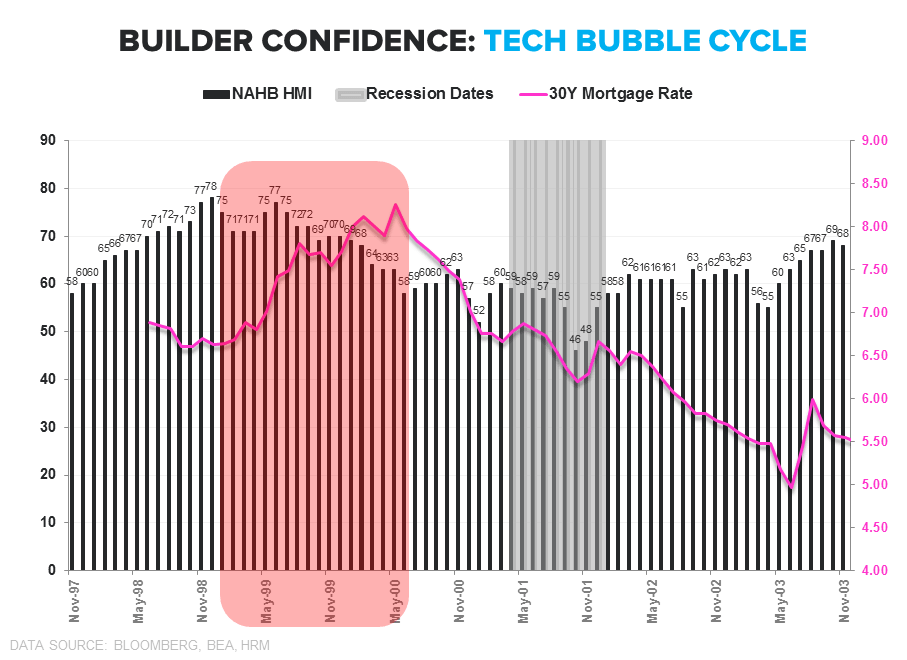
We profiled HMI and builder equity performance across the prior two cycles last month (See: Builder Confidence: Headfake or Harbinger?).
Broadly, the trend in HMI has served as a good lead indicator for housing fundamentals and the broader economy and a decent coincident indicator for housing related equities. Historically, there have been multiple instances in which HMI weakened for 1 or 2 months only to bounce back. However, successive months of weakness have generally signaled further, ongoing softening.
YELLOW LIGHTS & DURATION SENSITIVITY: Given the historical precedent around multi-month softening in sentiment and the apparent certainty of Janet & Co. pursing policy normalization into decelerating growth, we’d take the 2nd month of decline in the HMI as a cautionary signal.
In the nearer-term, both interest rate and market volatility should continue feed investor angst arund interest rate sensitive exposures and higher beta/higher leverage style factors. Beyond the knee-jerk and shorter-term reactions, we expect a shallow hiking cycle (if any at all) with curve flattening and a modest drift in mortgage rates – similar to the 1988 and 2004 tightening cycles where rates on 30Y FRM contract largely traded sideways.
We show the trend in HMI alongside inflections in policy and 30Y FRM rates across prior cycles in the series of charts below.


About the NAHB HMI:
The Housing Market Index (HMI) is based on a monthly survey of NAHB members designed to take the pulse of the single-family housing market. The monthly survey has been conducted for 30 years. The survey asks respondents to rate market conditions for the sale of new homes at the present time and in the next 6 months as well as the traffic of prospective buyers of new homes. The HMI is a weighted average of separate diffusion indices for these three key single-family series. The HMI can range from 0 to 100, where a value over 50 implies conditions are, on average, improving, a value below 50 implies conditions are worsening, and an index value of 50 indicates that the housing market is neither improving nor worsening.
Joshua Steiner, CFA
Christian B. Drake