
“It’s hard to get a man to understand something when his salary depends on his not understanding it.”
-Upton Sinclair
Lucky for the Hedgeye crew, our advancement as a new age financial research and media firm depends on our “understanding it.” That’s a promising model for me. I’m not a dramatic storyteller.
Unlike when we originally introduced our deflation theme ~18 months ago, a much larger camp has come around to our house view. The pushback really isn’t that surprising when you step back and think about the number of people who are paid by inflation.
Informational advantage is continuously becoming harder and harder to monetize. There are few industries where this advantage has been more lucrative in the past than financial services. Everyone now has the technology and systems to absorb and contextualize information and its implications. New information is now immediately new knowledge within seconds. This game is harder than ever.
So with all of the technology to absorb, contextualize, and execute on information why was $71 WTI in the fall of 2014 a marginal cost floor and a price for an OPEC cut (a consensus “buy”) that took WTI down 10% after the day a “no cut” happened, but with $41 in front of WTI, net futures and options positioning is shortest since we introduced our deflation theme, no cut from OPEC was consensus, and WTI is a falling knife?
To borrow the three stages of a market cycle from Howard Marks (this is a bull market description, but the psychological pendulum swings both ways):
- A few forward looking people begin to believe things will get better
- Most investors realize improvement is underway
- Everyone’s sure things will get better forever
If you flip this cycle around (the pendulum), we’re somewhere between 2) investors coming around to the fact that deterioration is underway; and 3) "blood in the streets."
Technological advancement plotted against time may look like an exponential function, but human nature looks just about the same. Investor psychology is a slippery slope and “value” is a slippery floor.

Back to the Global Macro Grind…
The question we continue to debate with clients is whether or not the carnage in cyclical sectors is over (Energy (XLE -21% YTD), Materials (XLB -6% YTD), and Industrials (XLI -6% YTD) lead S&P 500 sectors to the downside in 2015 after relative weakness in 2014). You can call XLE a definitive crash.
Put another way, can cyclicals go much lower even though we haven’t entered a technical recession? Absolutely, if the cycle cycles. We still think a recession commencing by mid-2016 is becoming increasingly probable.
We wrote a note last week on the "Unlikeliness of an OPEC Cut." We were right on the no cut, but admittedly, some of the behavioral expectations we outlined that have suggested crude could trade higher have not manifest over the last several trading days: contract positioning, volatility skew, volatility expectations, and a crowded rate hike trade. The Fed meeting next week is undoubtedly a catalyst.
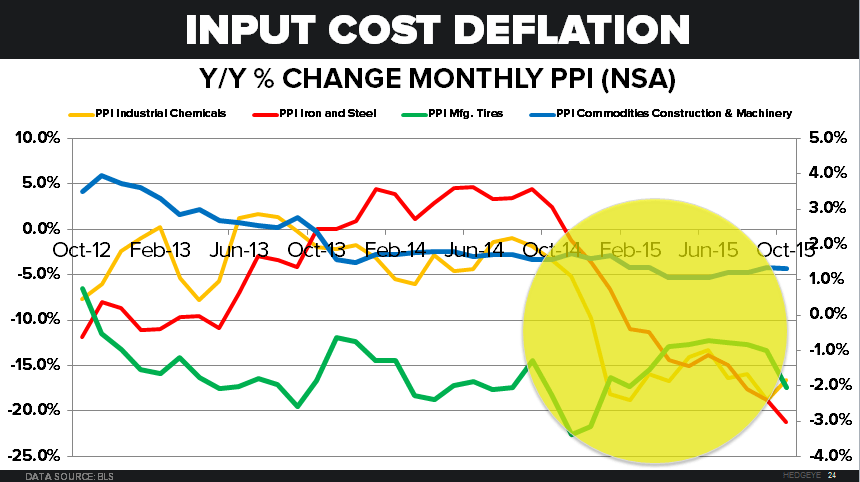
Even the firm with the non-consensus 18-month deflation view, wrestles with the location of a bottom. The truth is that in addition to quantitative behavioral factors that have been good indicators, the fundamental supply-demand picture will probably play a role. A supply-side backstop is proving to be an elusive, slippery floor in commodity-intensive cyclicals because the floor itself deflates with deflation (chart of the day at the bottom):
- PPI Industrial Chemicals peaked on a Y/Y NSA rate of change basis in September 2014 and has been negative since September 2013
- PPI Iron and Steel peaked on a Y/Y NSA rate of change basis in October 2014
- PPI Commodities Construction & Machinery has been declining on a Y/Y NSA rate of change basis since June 2014, and it’s been tracking negative since October 2013
- PPI Mfg. tires has been tracking negative on that same Y/Y NSA % change basis since October 2012
Cost input inflation peaked right around the time the Fed-fueled capital spending boom peaked. The number of projects with attractive hurdle rates multiplies in a bull market. Commodity producer debt (large miners, oil majors, oil and gas equipment services, and coal miners) has skyrocketed:
- 2005: $200Bn
- 2010: $550Bn
- 2014: $1.1 Trillion with a “T”
And taking an example from the gold miners, Net PP&E per Oz. of production is near pinned at the highs:
2003: 0.5 (ratio)
2010: 2.5
2015: 3.2
Policy fueled inflation expectations helped propel a surplus of mediocre investment decisions at the highs in commodity prices, and once the capital spending wheel is turning, producers will produce.
It’s not just hedges, long-term contracts, and private capital that prolong a bottom. It’s the technological advancement of operational efficiency and deflation on the cost side. The relationship between gold prices and Newmont Mining’s cash cost since 1985 has an r-squared correlation of 0.95.
The slippery slope of deflation's feedback loop could stay slippery for a little longer. And don’t forget that the cycle cycles.
Our immediate-term Global Macro Risk Ranges are now:
UST 10yr Yield 2.13-2.31%
SPX 2039-2075
VIX 16.32-20.58
EUR/USD 1.05-1.09
Oil (WTI) 36.08-39.91
Good luck out there today,
Ben Ryan
Analyst
