

Our Hedgeye Housing Compendium table (below) aspires to present the state of the housing market in a visually-friendly format that takes about 30 seconds to consume.
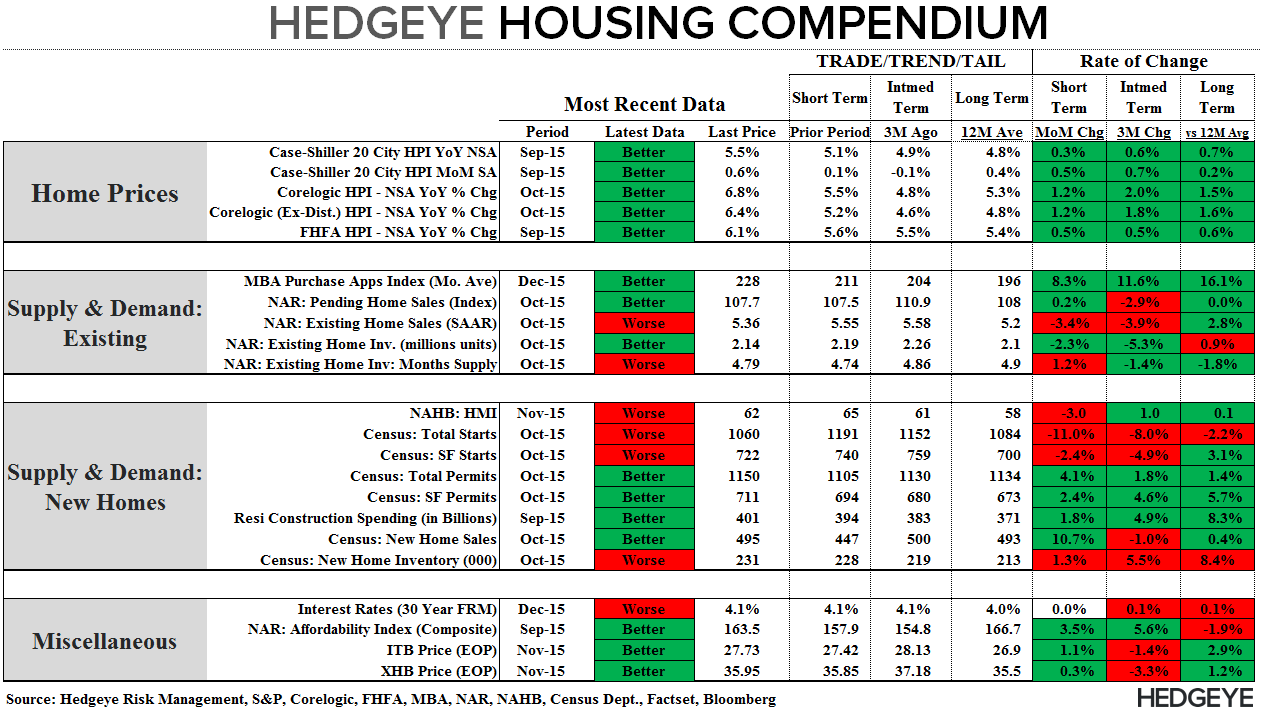
Today’s Focus: MBA Purchase Applications
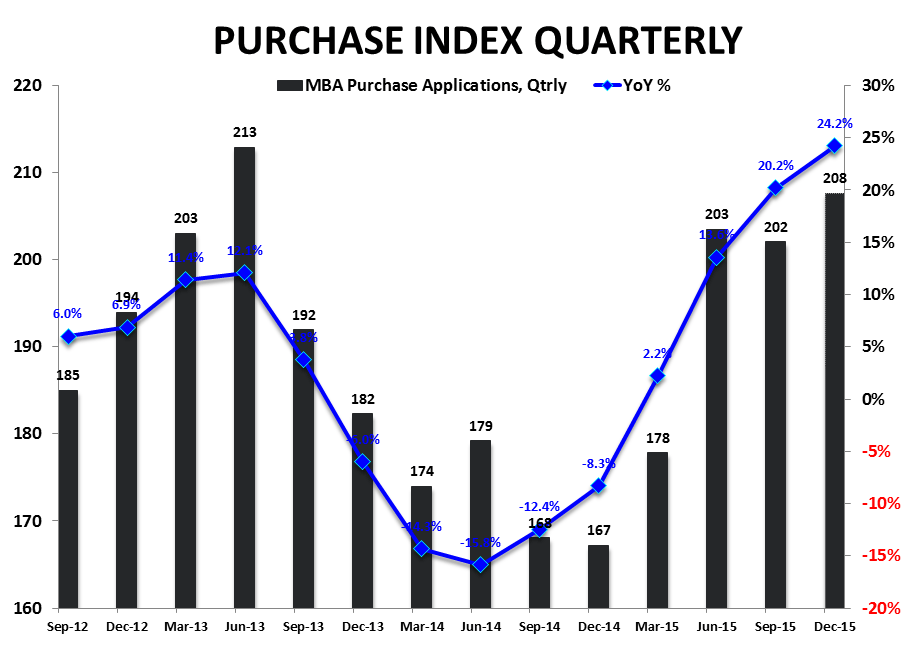
The momo in purchase demand continued in the latest week with seasonally adjusted weekly activity holding at 5-year highs and average monthly activity in November finishing at its highest level since mid-2013.
Purchase applications were flat sequentially (+0.05% WoW) at the 228.2-level on the Index with growth decelerating modestly to +28.4% YoY. On a quarterly basis, 4Q is tracking +2.8% QoQ and +24.2% YoY.
The read-through on this weeks data remains largely unchanged relative to the week prior (see: Purchase Apps | New Highs ...& Salt Grains):
Conclusion - The high-frequency data remains hostage to seasonal noise associated with imperfect peri-holiday statistical adjustments and we’re probably observing some measure of demand pull-forward associated with the impending policy rate increase. But, on balance, the 5-week streak of above trend demand suggests the uptick in purchase activity aptly characterizes the underlying reality– if not in magnitude, at least directionally.


About MBA Mortgage Applications:
The Mortgage Bankers’ Association’s mortgage applications index covers more than 75% of mortgage applications originated through retail and consumer direct channels. It does not include loans delivered through wholesale broker and correspondent channels. The MBA mortgage purchase applications index is considered a leading indicator of single-family home sales and construction. Moreover, it is the only housing index that is released on a weekly basis.
Frequency:
The MBA Purchase Apps index is released every Wednesday morning at 7 am EST.
Joshua Steiner, CFA
Christian B. Drake
