Editor's Note: Below is a brief excerpt and chart from today's Early Look written by Hedgeye CEO Keith McCullough. Click here to subscribe.
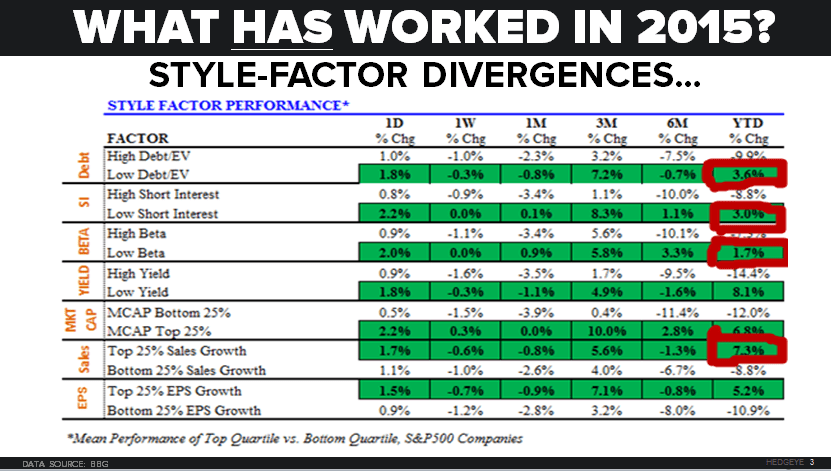
"... You get the point – what’s worked during #Deflation and GDP slowing in 2015 is:
- Good Balance Sheets: Low Debt = +3.6% YTD
- Quality: Low Beta and Low Short Interest +1.7% and +3.0% YTD, respectively
- Organic Sales Growth: Top 25% Sales Growers in the SP500 = +7.3% YTD
That’s why that +7.8% YTD performance for the XLK (Tech) is so close to the Organic Sales Growth Style Factor (hint: they are largely the same stocks). And it’s also why the illusion of growth (levered companies like Kinder Morgan, KMI, and Valeant, VRX) crashed."