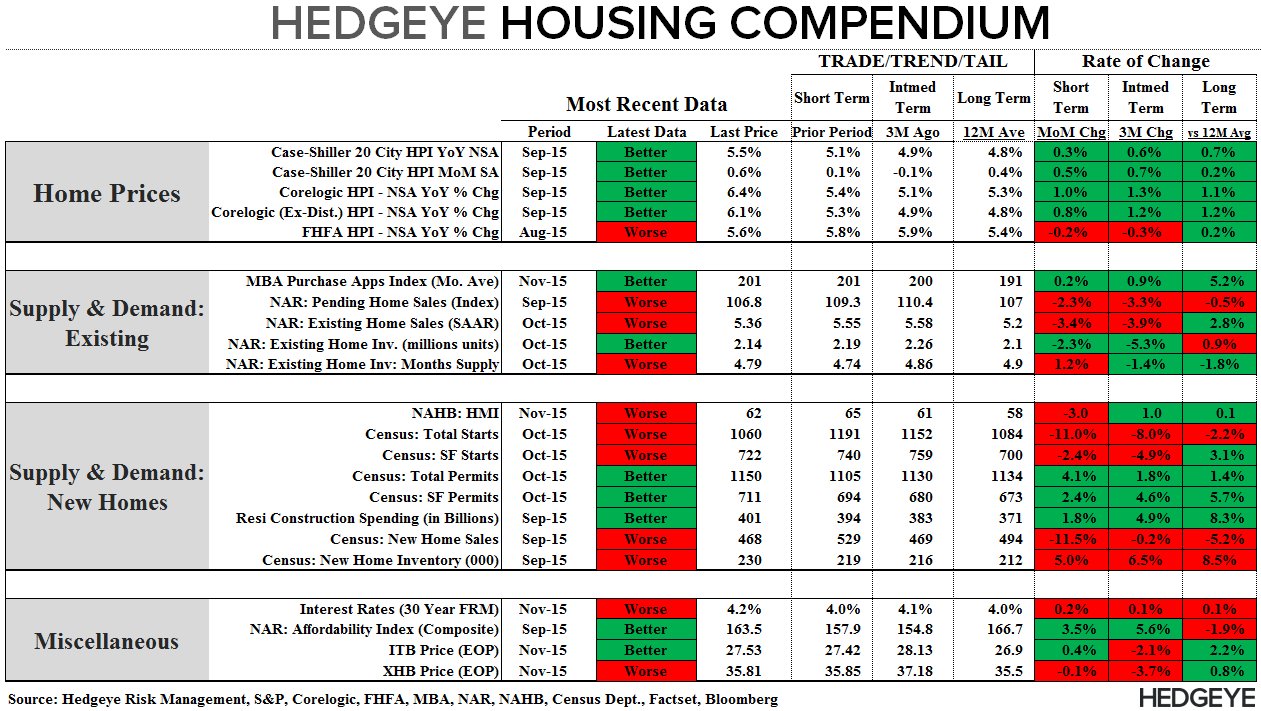
Our Hedgeye Housing Compendium table (below) aspires to present the state of the housing market in a visually-friendly format that takes about 30 seconds to consume.
Today’s Focus: September Case-Shiller HPI
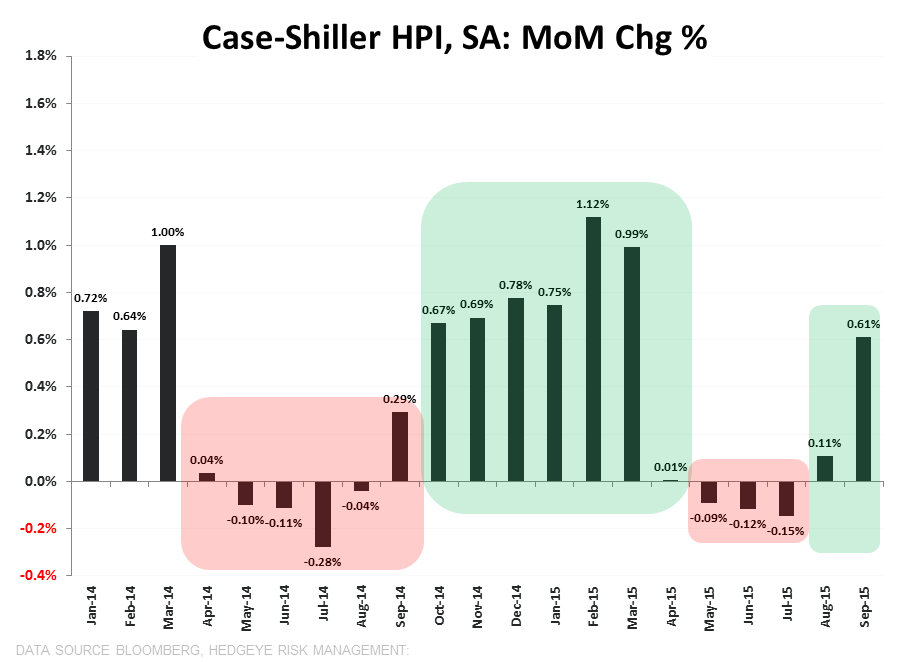
The Data: The Case-Shiller 20-City HPI for August released this morning – which represents average price data over the July-September period – showed home prices rose +0.61% MoM while accelerating +32bps sequentially to +5.45% year-over-year. On an NSA basis, 18 of 20 cities reported sequential increases while, on an SA basis, 19-cities reported increases. The gain in September was the largest in 7-months and marked a 3rd consecutive month of acceleration. Notably, the Case-Shiller National HPI (which covers all U.S. Census divisions) accelerated for the 7th straight month, accelerating +30bps sequentially to +4.86% YoY.
Inventory ↓, HPI ↑ | As was again highlighted yesterday in the EHS data for October, inventory remains very tight relative to the historical average and should continue to support positive HPI trends. Improving second derivative price trends have augured outperformance in the housing complex historically as rising prices are margin supportive and help perpetuate the Giffen Good dynamic that characterizes housing demand.
Supply Stagnation: We reviewed the lead factors underpinning the supply stagnation in housing a few months ago but they are worth a quick recapitulation:
- Low Rates: Low rates locked in during the post-crisis period remain a disincentive to selling/moving and an inertial headwind to rising inventory.
- Demographics: Top heavy demographics with Boomers (which are a significant % of the homeownership base) entering their peri-retirement period will weigh on housing turnover broadly. Aging in place remains an emergent trend and moving-out will not become an outsized driver of supply for another decade when the Boomer bulge starts moving beyond 80 YOA.
- Equity: If Boomers are dragging on inventory and Millennial demand is just beginning to percolate, what’s left? Mostly Gen X’ers. Those aged ~35-50 represent a significant source of potential supply in the form of trade-up buying. A meaningful percentage in this group, however, remain in negative or near-negative equity positions, serving as weight to both entry level supply and mid/upper market demand.
- Credit Box: Tighter standards for would be purchasers have constricted the mortgage credit box and have dissuaded and/or been prohibitive for low equity homeowners looking to move up the housing ladder.
The last quick highlight is that the 10 and 20-City Indices carry “key man risk” over the medium-term as index heavyweights such as L.A. (15.2% Weight) and San Francisco (8.4% Weight) and to a lesser extent New York (19.4% Weight) bump up against progressively tougher 1Y and 2Y comps.
In summary, the Case-Shiller HPI continues to track the CoreLogic HPI data on a lag with both series displaying modest acceleration in recent months. We’re more interested to see the CoreLogic data for October due for release next week.


About Case Shiller:
The S&P/Case-Shiller Home Price Index measures the changes in value of residential real estate by tracking single-family home re-sales in 20 metropolitan areas across the US. The index uses purchase price information obtained from county assessor and recorder offices. The Case-Shiller indexes are value-weighted, meaning price trends for more expensive homes have greater influence on estimated price changes than other homes. It is vital to note that the index’s printed number is a 3-month rolling average released on a two month delay.
Frequency and Release Date:
The S&P/Case-Shiller HPI is released on the last Tuesday of every month. The index is on a two month lag and therefore does not reflect the most recent month’s home prices.
Joshua Steiner, CFA
Christian B. Drake