The restaurant industry macro picture is continuing to deteriorate. According to Black Box Intelligence numbers, restaurant traffic growth has been negative for nine straight months, going back to February 2015. In this type of environment one must be very selective on LONG calls, while we continue to see a growing number of SHORT opportunities. Commodity deflation will be an interesting dynamic in 2016. It will help the margins of many restaurant companies, especially those focused on beef, as we highlighted in our THOUGHT LEADER call regarding #BEEFDEFLATION. But on the other hand, the consumer will see a widening divergence between the cost to eat out and the cost to cook for themselves.
Black Box Sales, Traffic
Black Box released same-restaurant sales and traffic estimates for the month of October that showed a steep deceleration sequentially as the YoY trend continues to deteriorate. Same-restaurant sales posted negative growth for the first time since June 2014, posting a down -0.2% number, which is a 100bps sequentially decline. Same-restaurant traffic decreased -2.8%, a 50bps sequential decline, and down 320bps YoY.


Restaurant price increases were down slightly in October. As you can see from the chart below, the convergence between the operators taking price and a decline in traffic that we had been seeing deteriorated in October as traffic trends began to turn south.

Knapp October Sales Trends
Knapp reported that comparable restaurant sales in October 2015 were -0.7% for same-store sales and –2.9% for guest counts. October comparable restaurant sales represent a 170bps sequential slowdown, additionally traffic was down 220bps sequentially. On a 2-year basis, sales slowed to +0.6% and traffic declined -1.4%.


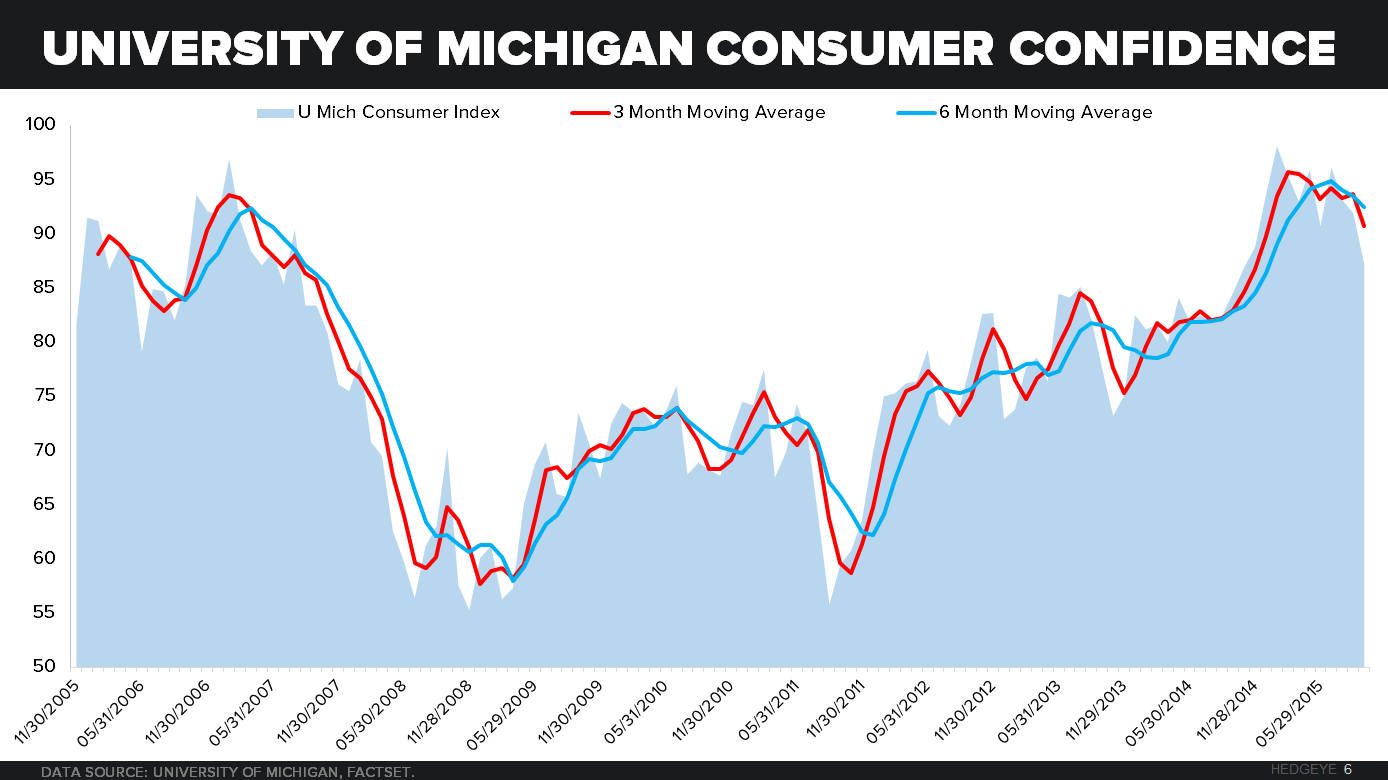
Consumer confidence slowing

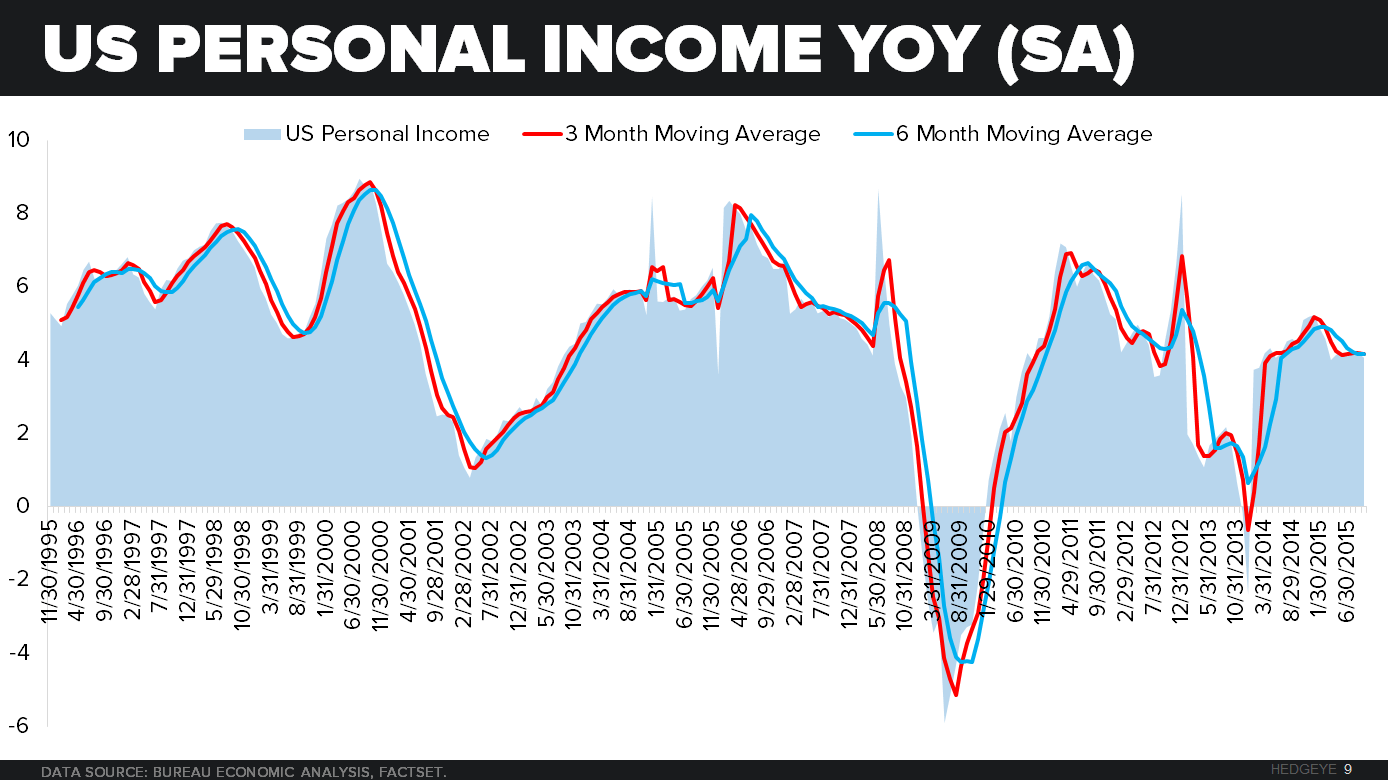
Employment Growth Continuing to Slow
In the month of October we saw a marked deceleration in the employment trend, driven by a decline within the 20-24 YOA cohort. The downward trend that we were concerned about seems be getting worse. This continued slowdown across age cohorts points to troubling labor picture.
October Employment Growth Data:
- 20-24 YOA -0.35% YoY; -151.3bps sequentially
- 25-34 YOA +1.73% YoY; -50.9bps sequentially
- 35-44 YOA +1.15% YoY; +9.8bps sequentially
- 45-54 YOA +0.05% YoY; -7.4bps sequentially
- 55-64 YOA +1.78% YoY; +54.5bps sequentially

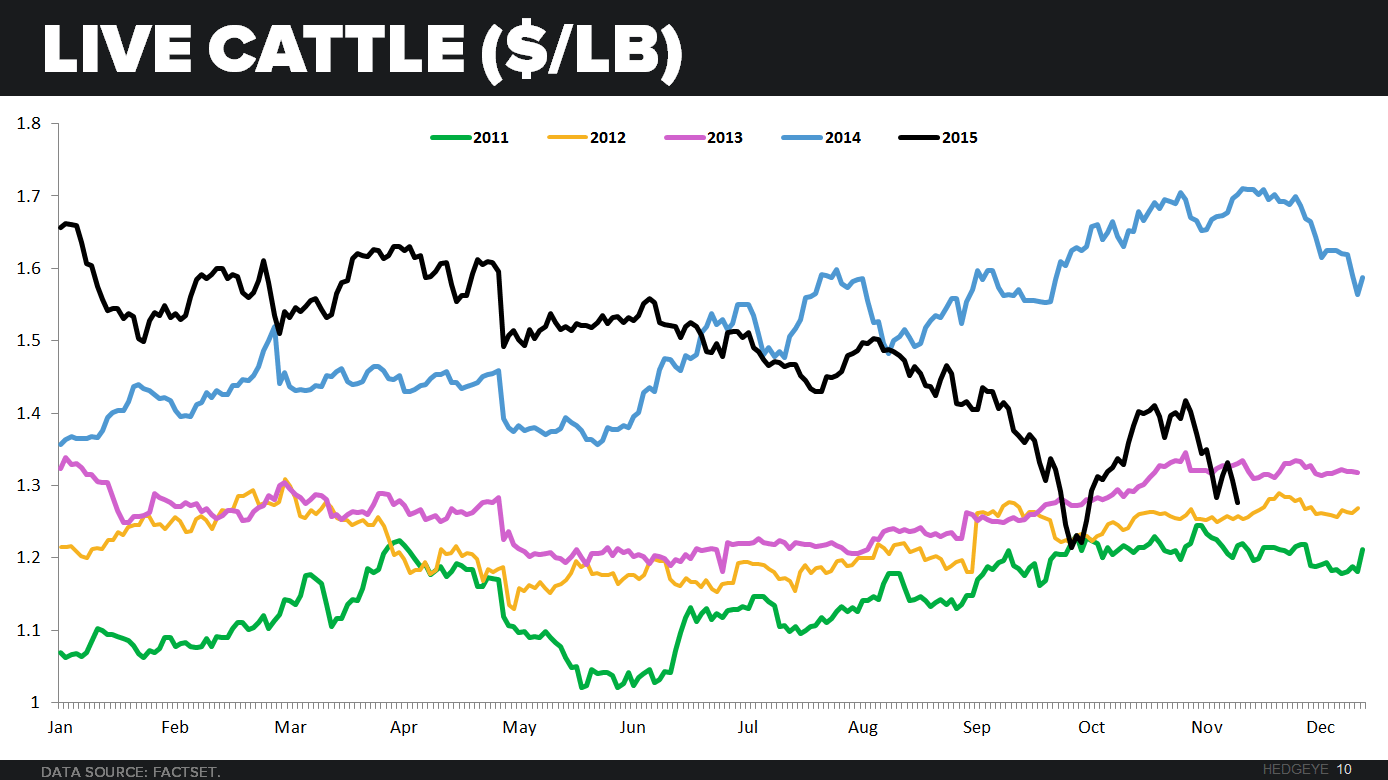
Commodities
In 2016, as many restaurant companies have been speaking to, we are headed for commodity basket deflation. With major proteins such as beef expected to have down years, this could be a great tailwind for restaurant companies. In addition to beef, corn, wheat, live hogs and soybeans are trending below year-ago levels.


Please call or e-mail with any questions.
Howard Penney
Managing Director
Shayne Laidlaw
Analyst