Our Hedgeye Housing Compendium table (below) aspires to present the state of the housing market in a visually-friendly format that takes about 30 seconds to consume.
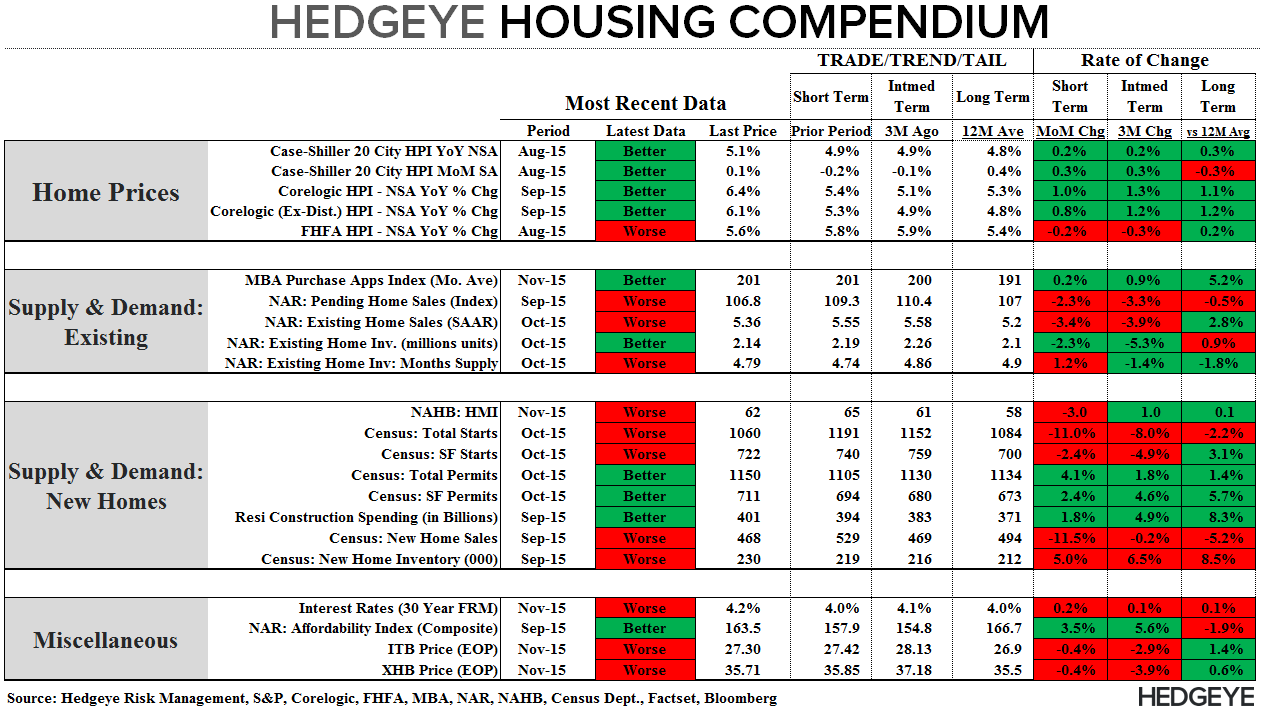
Today's Focus: October Existing Home Sales
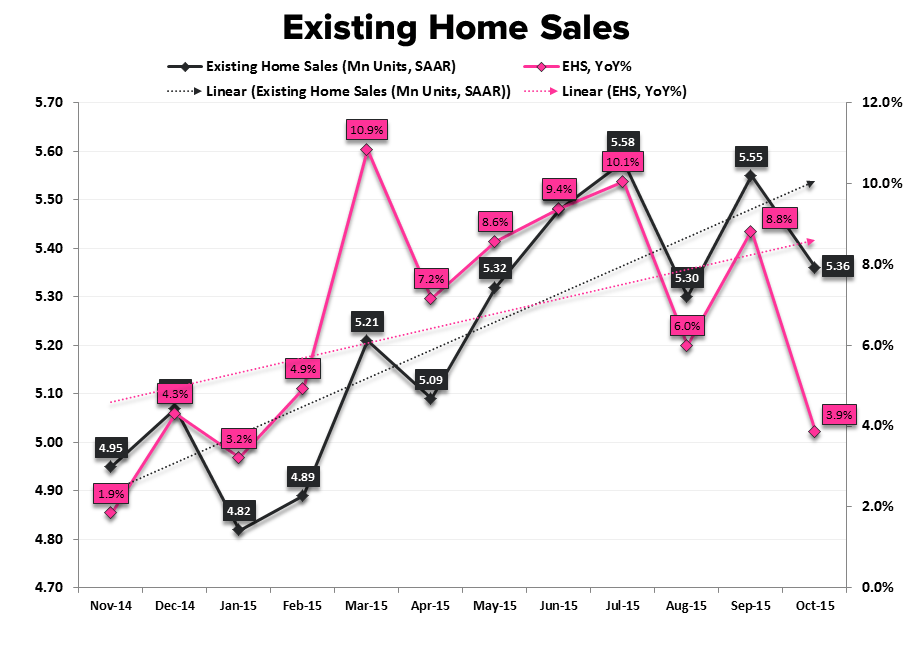
EHS: Predictably (HERE), EHS in October retreated -3.4% month-over-month, almost fully re-coupling with the Trend in Pending Sales. After retracing back to cycle highs in September, EHS fell to 5.36MM and decelerated to +3.9% YoY – the slowest pace of growth in 9 months as we begin to traverse steadily steepening comps.
As always – because closings are largely a lagged function of contract signings - we're more interested in next week’s Pending Home Sales data. PHS for October will provide an important update on the softening demand trend observed over the last two months and whether recent regulatory changes are having a measurable impact. Notably, any first evidence of TRID related bottlenecks/impacts should be evident in the November EHS (released 12/22) as the first bolus of Post-TRID (implemented Oct 3rd) closings will occur in November.
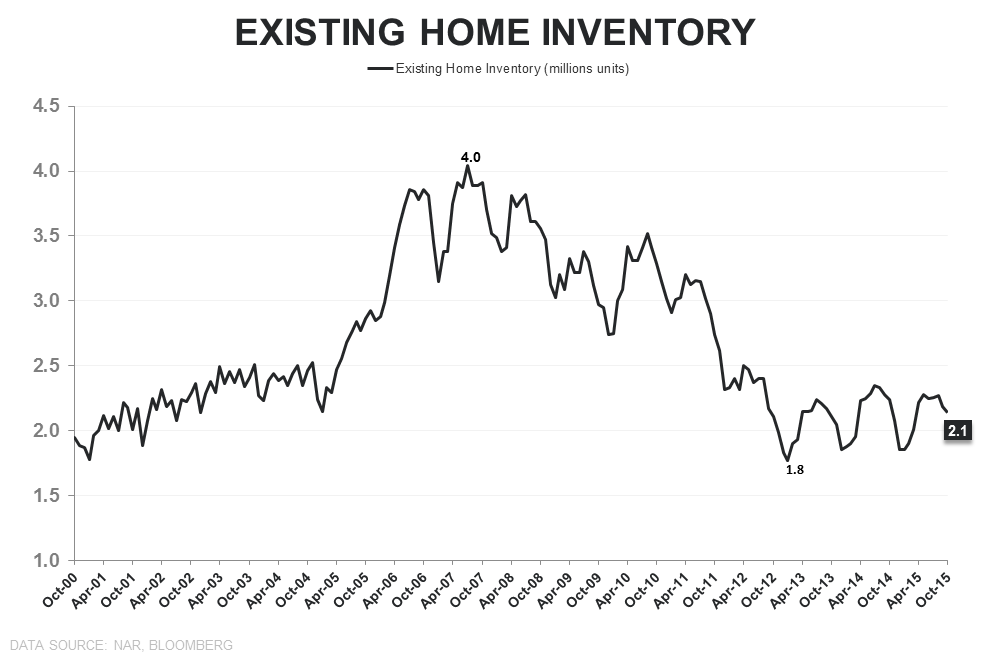
Inventory & Price: Units of inventory dropped for a second month, declining -2.28% MoM in October to 2.14 mm. With sales declining more than supply, inventory on a month-supply basis rose slightly to 4.79-months, marking the 38th consecutive month below the traditional balanced market level of 6-months. Ongoing supply tightness in the 90% of the market that is EHS remains supportive of improving HPI trends in the nearer-term.
1st-Time Buyers: First-time buyers rose to 31% of the market in October, up from 29% recorded last month and in October of last year. In contrast to the headline decline (& YoY deceleration), sales to 1st-time buyers rose +3.2% MoM and accelerated +220bps sequentially to +11% year-over-year in October. So long as the labor/income fundamentals continue to improve across the 20-40YOA demographic, rising headship rates and single-family purchase demand should continue to manifest on a moderate lag. Further, alongside the ongoing improvement in entry level buyer demand, the crawling trend towards housing market normalization continued as all cash sales declined to 24% of transactions (down from 27% last year) while distressed sales fell to the lowest level since 2008 at 6%.


About Existing Home Sales:
The National Association of Realtors’ Existing Home Sales index measures the number of closed resales of homes, townhomes, condominiums, and co-ops. Existing home sales do not take into account the sale of newly constructed homes. Existing home sales account for 85-95% of all home sales (new home sales account for the remainder). Therefore, increases in existing home sales tend to signify increasing consumer confidence in the market. Additionally, Existing Home Sales is a lagging series, as it measures the closing of homes that were pending home sales between 1 and 2 months earlier.
Frequency:
The NAR’s Existing Home Sales index is published between the 20th and the 22nd of each month. The index covers data from the prior month.
Joshua Steiner, CFA
Christian B. Drake