


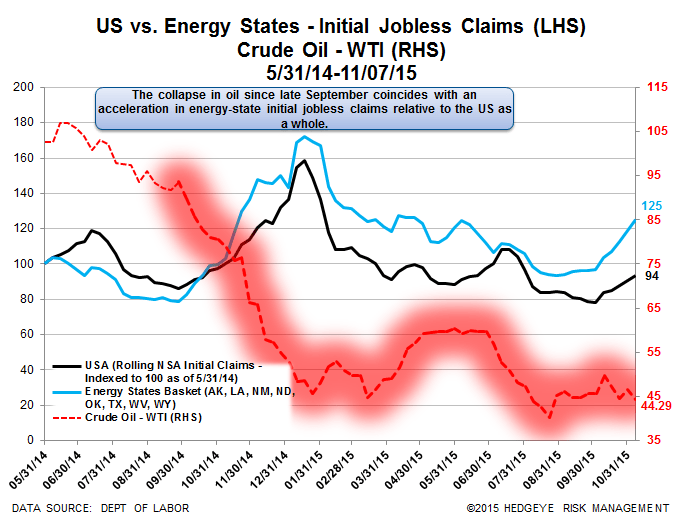
As we come to the end of '15, jobless claims both in aggregate and for the energy states separately, are behaving as we have modeled. Year-over-year improvement continues to converge towards zero as the level of claims backs up off of the low but remains within its frictional floor below 330k (for 21 months now). We continue to point out that the last three cycles saw claims sit below 330k for 24, 45 and 31 months before the economy entered recession, putting us 12 months from the 33-month average.
Additionally, energy state claims are worsening versus the country as a whole as many energy companies are set to experience the pain of their price hedges rolling off around year-end. The spread between those two indexed series in our chart below has widened for 10 weeks in a row. That includes the most recent week, ending November 7, when the spread widened from 28 to 31.
The Data
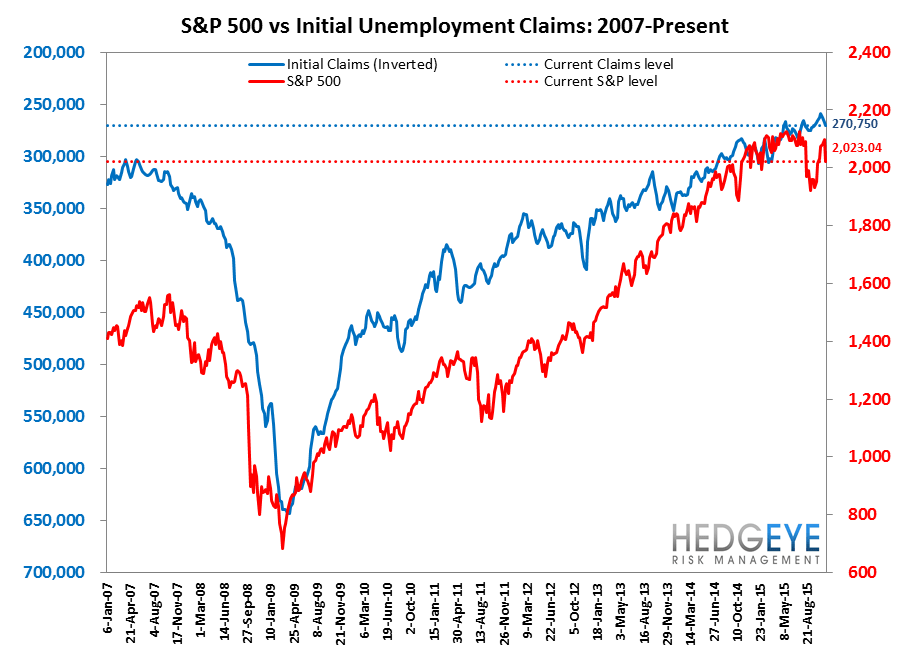
Initial jobless claims fell 5k to 271k from 276k WoW. The prior week's number was not revised. Meanwhile, the 4-week rolling average of seasonally-adjusted claims rose 3k WoW to 270.75k.
The 4-week rolling average of NSA claims, another way of evaluating the data, was -6.7% lower YoY, which is a sequential deterioration versus the previous week's YoY change of -7.0%


Yield Spreads
The 2-10 spread fell -8 basis points WoW to 140 bps. 4Q15TD, the 2-10 spread is averaging 143 bps, which is lower by -10 bps relative to 3Q15.


Joshua Steiner, CFA
Jonathan Casteleyn, CFA, CMT
