

Investment Company Institute Mutual Fund Data and ETF Money Flow:
In the 5-day period ending November 11th, investors tip toed out into equities and shored up cash, contributing +$3.1 billion to total equity products (mutual funds and ETFs) while withdrawing -$2.8 billion from total bond proxies (mutual funds and ETFs). Within equities, investors continued to pull capital from active domestic mutual funds, withdrawing -$2.4 billion last week which have now amounted to a total drawdown of -$139.9 billion so far in 2015 (the worst start to a year for domestic equity funds in all ICI data). Meanwhile, investors also shored up +$12 billion of cash in money market funds, continuing the trend of inflows in the second half of 2015. This brings cumulative 4Q15TD money market flows to +$45 billion, following the 3Q15 inflow of +$54 billion. We continue to like the cash management space and out of favor Federated Investors (see our FII report) on a combination of positive balance builds and profitability improvements in the business for '16/'17.

In the most recent 5-day period ending November 11th, total equity mutual funds put up net outflows of -$1.3 billion, trailing the year-to-date weekly average outflow of -$701 million and the 2014 average inflow of +$620 million. The outflow was composed of international stock fund contributions of +$1.1 billion and domestic stock fund withdrawals of -$2.4 billion. International equity funds have had positive flows in 45 of the last 52 weeks while domestic equity funds have had only 8 weeks of positive flows over the same time period.
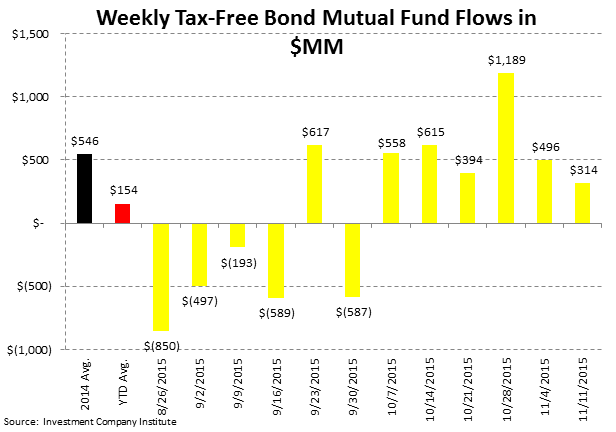
Fixed income mutual funds put up net outflows of -$686 million, trailing the year-to-date weekly average inflow of +$230 million and the 2014 average inflow of +$926 million. The outflow was composed of tax-free or municipal bond funds contributions of +$314 million and taxable bond funds withdrawals of -$1.0 billion.
Equity ETFs had net subscriptions of +$4.4 billion, outpacing the year-to-date weekly average inflow of +$2.2 billion and the 2014 average inflow of +$3.2 billion. Fixed income ETFs had net outflows of -$2.1 billion, trailing the year-to-date weekly average inflow of +$1.1 billion and the 2014 average inflow of +$1.0 billion.
Mutual fund flow data is collected weekly from the Investment Company Institute (ICI) and represents a survey of 95% of the investment management industry's mutual fund assets. Mutual fund data largely reflects the actions of retail investors. Exchange traded fund (ETF) information is extracted from Bloomberg and is matched to the same weekly reporting schedule as the ICI mutual fund data. According to industry leader Blackrock (BLK), U.S. ETF participation is 60% institutional investors and 40% retail investors.
Most Recent 12 Week Flow in Millions by Mutual Fund Product: Chart data is the most recent 12 weeks from the ICI mutual fund survey and includes the weekly average for 2014 and the weekly year-to-date average for 2015:


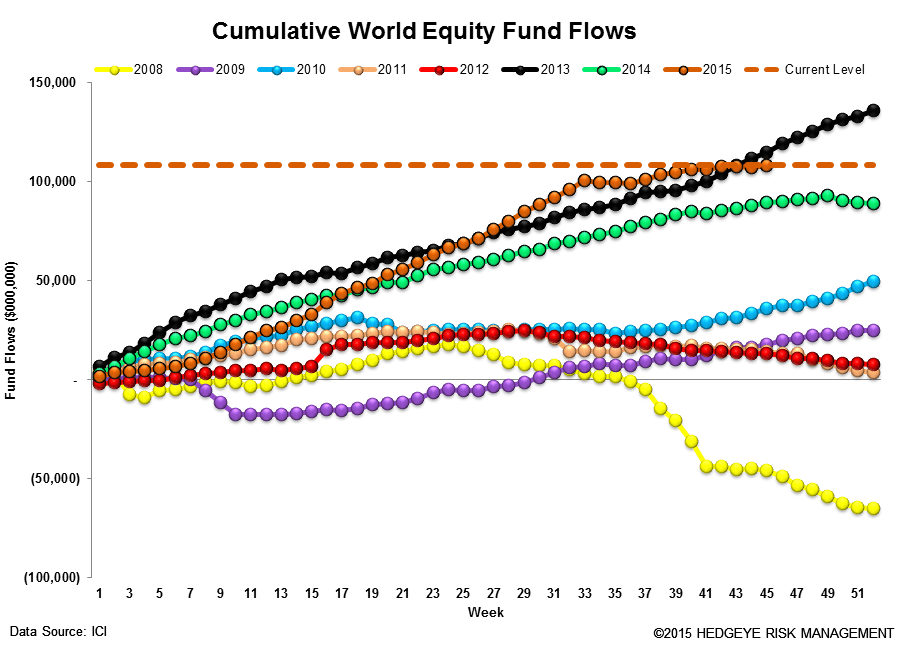
Cumulative Annual Flow in Millions by Mutual Fund Product: Chart data is the cumulative fund flow from the ICI mutual fund survey for each year starting with 2008.


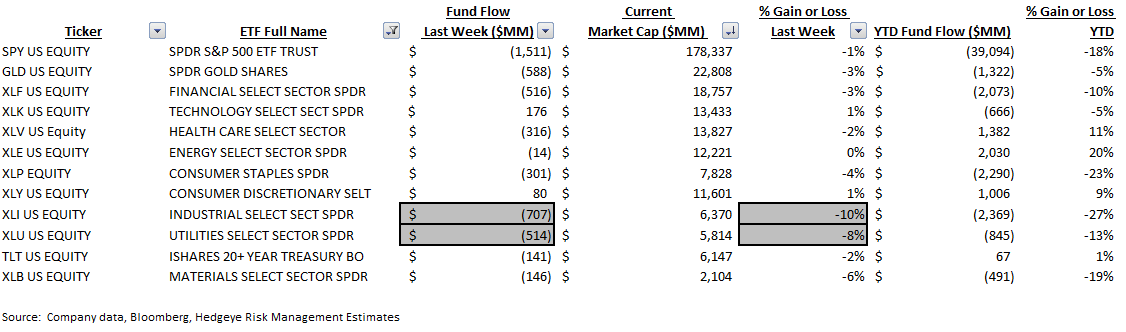
Most Recent 12 Week Flow within Equity and Fixed Income Exchange Traded Funds: Chart data is the most recent 12 weeks from Bloomberg's ETF database (matched to the Wednesday to Wednesday reporting format of the ICI), the weekly average for 2014, and the weekly year-to-date average for 2015. In the third table are the results of the weekly flows into and out of the major market and sector SPDRs:


Sector and Asset Class Weekly ETF and Year-to-Date Results: In sector SPDR callouts, the industrials XLI and utilities XLU ETFs experienced significant outflows of -$707 million or -10% and -$514 million or -8%, respectively.
Cumulative Annual Flow in Millions within Equity and Fixed Income Exchange Traded Funds: Chart data is the cumulative fund flow from Bloomberg's ETF database for each year starting with 2013.


Net Results:
The net of total equity mutual fund and ETF flows against total bond mutual fund and ETF flows totaled a positive +$5.9 billion spread for the week (+$3.1 billion of total equity inflow net of the -$2.8 billion outflow from fixed income; positive numbers imply greater money flow to stocks; negative numbers imply greater money flow to bonds). The 52-week moving average is +$922 million (more positive money flow to equities) with a 52-week high of +$27.9 billion (more positive money flow to equities) and a 52-week low of -$19.0 billion (negative numbers imply more positive money flow to bonds for the week.)

Exposures: The weekly data herein is important for the public asset managers with trends in mutual funds and ETFs impacting the companies with the following estimated revenue impact:

Jonathan Casteleyn, CFA, CMT
Joshua Steiner, CFA
