

Our Hedgeye Housing Compendium table (below) aspires to present the state of the housing market in a visually-friendly format that takes about 30 seconds to consume.

Today’s Focus: October Housing Starts & Permits & MBA Purchase Apps
Housing Starts & Permits:
In short = not great but better than the headline as single-family starts dip -2.4% sequentially while MF permits suggest the decline in multi-family construction which weighed on the headline in October (-25.1% MoM) will likely reverse.
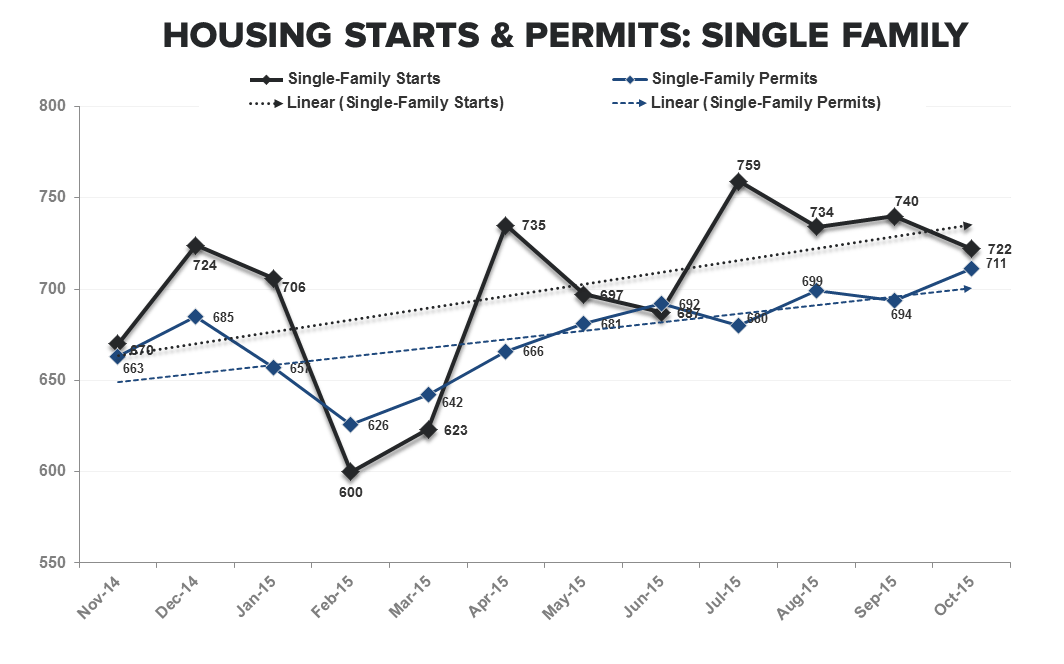
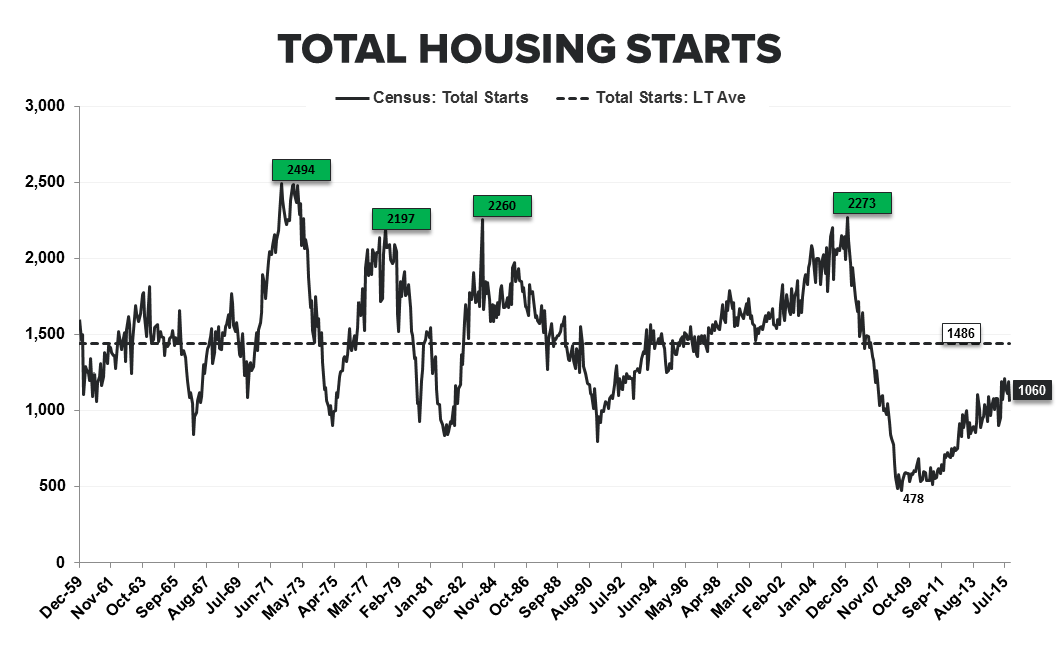
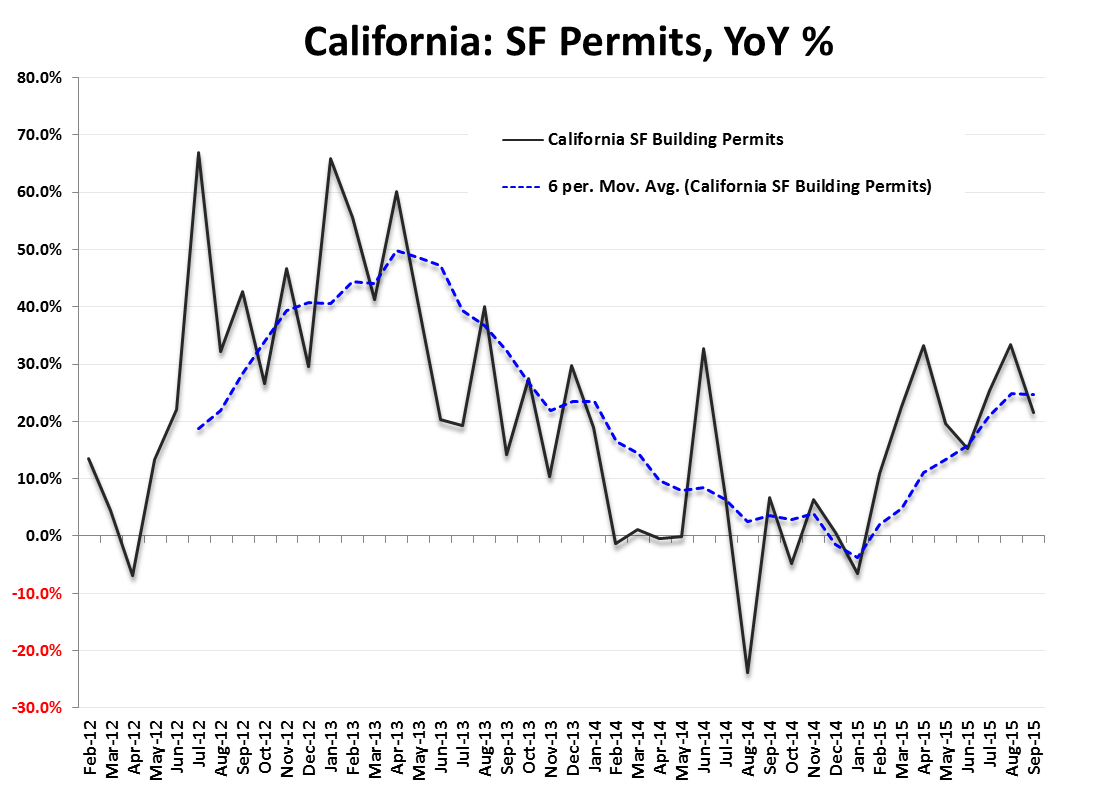
SF: Single Family Starts dropped -2.4% month-over-month and decelerated to +2% year-over-year while Permits did the exact opposite, rising +2.4% sequentially and making a new post-crisis high. With Permits making an 8-year high, the larger trend in SF construction continuing to stair-step higher (1st chart below) and +42% mean reversion upside remaining back to average historical levels of activity, the MT/LT opportunity remains conspicuous. In Texas and California where angst over state level drought/bubble and energy price issues have been real and rising, the trends have been somewhat divergent. Whereas SF permitting activity in California has accelerated in 2015, permit volume growth has been in steady deceleration YTD (note: the Census Bureau provides state-level permits data, not Starts directly, on a 1-month lag) .
MF: Multi-family Starts dropped -25% MoM to 338K while Permits rose +6.8% MoM to 439K – suggesting the smoothed, multi-month average in MF activity should remain Trend consistent.
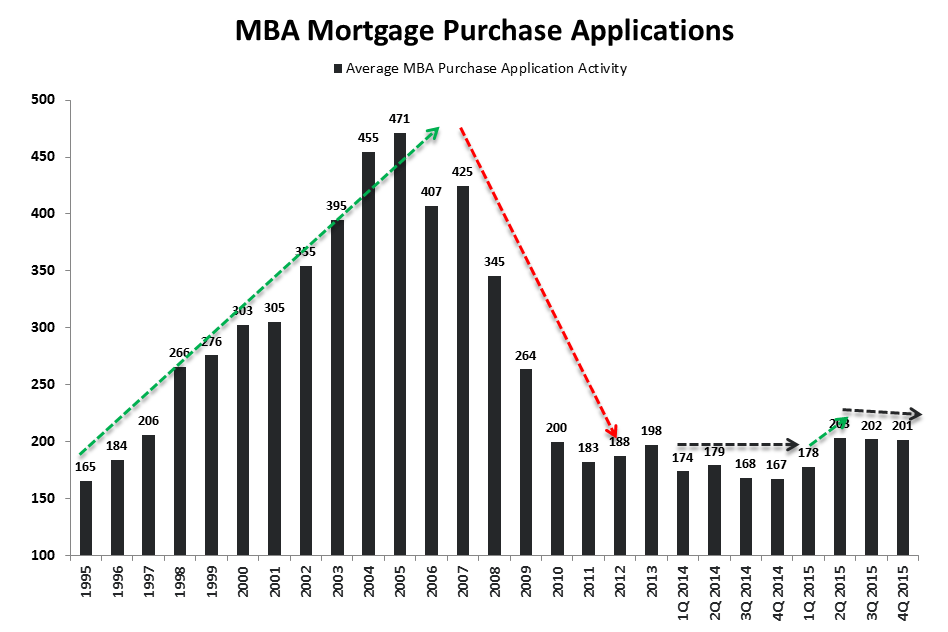
MBA Mortgage Purchase Applications
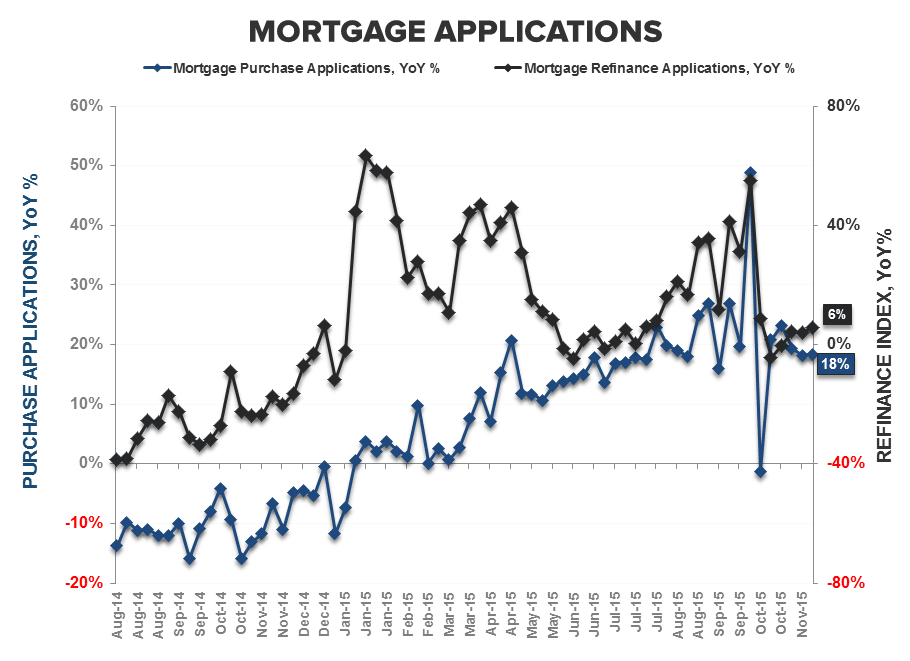
Purchase Demand rose +11.9% in the latest week, reversing 3-weeks of relative softness and taking November and 4Q15 back up to the YTD average.
The caveats: Last week included Veteran’s Day and high frequency, weekly data is noisy in peri-holiday periods despite statistical adjustments. We’d note that the seasonal adjustment factor this year was less supportive than what we’ve seen over the last four years so at face value the increase would appear quasi-legit or, at least, statistically non-anomolous.
Additionally, with Rates up another +6bps WoW to the highest level in 4-months at 4.18% (and the first positive YoY change in rates since June 2014), its also possible we’re seeing some measure of demand pull-forward with prospective buyers pulling the purchase trigger in fear of further financing based affordability declines.
So, what has become serial noise in the weekly Purchase Application data of late continued in the latest week. More broadly, after accelerating signficantly off the 4Q14 lows, the multi-month trend in Purchase Demand has been largely flat. Looking to next week, we expect a sequential decline in EHS as existing sales play catch-up to the trend in PHS.


About Housing Starts & Permits:
The US Census Bureau records the number of new housing units that have obtained permits for construction and those that have begun construction. This data includes new buildings intended primarily as residential units. The US Census Bureau defines a start as, “Start of construction occurs when excavation begins for the footings or foundation of a building.”
About MBA Mortgage Applications:
The Mortgage Bankers’ Association’s mortgage applications index covers more than 75% of mortgage applications originated through retail and consumer direct channels. It does not include loans delivered through wholesale broker and correspondent channels. The MBA mortgage purchase applications index is considered a leading indicator of single-family home sales and construction. Moreover, it is the only housing index that is released on a weekly basis.
Frequency:
The MBA Purchase Apps index is released every Wednesday morning at 7 am EST.
Joshua Steiner, CFA
Christian B. Drake
