

Our Hedgeye Housing Compendium table (below) aspires to present the state of the housing market in a visually-friendly format that takes about 30 seconds to consume.

Today's Focus: November NAHB HMI (Builder Confidence Survey)
Builder Confidence slipped -3pts in November, dropping for the 1st time in 6-months and retreating off the cycle high of 65 (revised +1pt) recorded in September. Across the sub-indices, Current Sales and 6M Expectations declined -3pts and -5pts, respectively, while Current Traffic rose +1pt sequentially. Regionally: West = +1pt and making a new 120-month high, South = -5pts off 120-mo high recorded last month, Midwest = -1pt MoM, Northeast = flat at 52 and holding at decade highs.
Off The Highs: Given the soft PHS and NHS data for October, it’s not particularly surprising to see Builder Confidence in November retreat moderately off the 10-year high recorded last month. One month does not a trend make but if October was indeed the peak, it would fall well below the prior cycle highs of 71, 78 and 72.
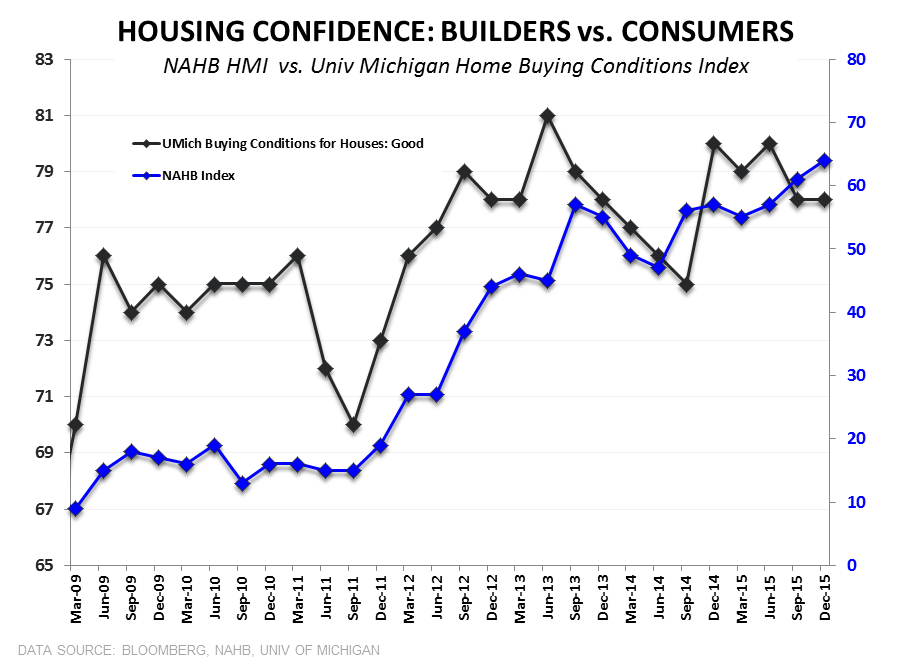
Builder vs Consumer Confidence: The pullback in the HMI is in-line with the recent trend in broader measures of consumer confidence which peaked in 1Q15 and have softened since. Up to now, what has been interesting was the continued momentum in both the headline and forward expectations readings in the HMI, particularly given the tendency for Builder Confidence to lead both Consumer Confidence and broader macro inflections over recent cycles. We discussed this divergence in greater detail in reviewing the October HMI data (HERE).
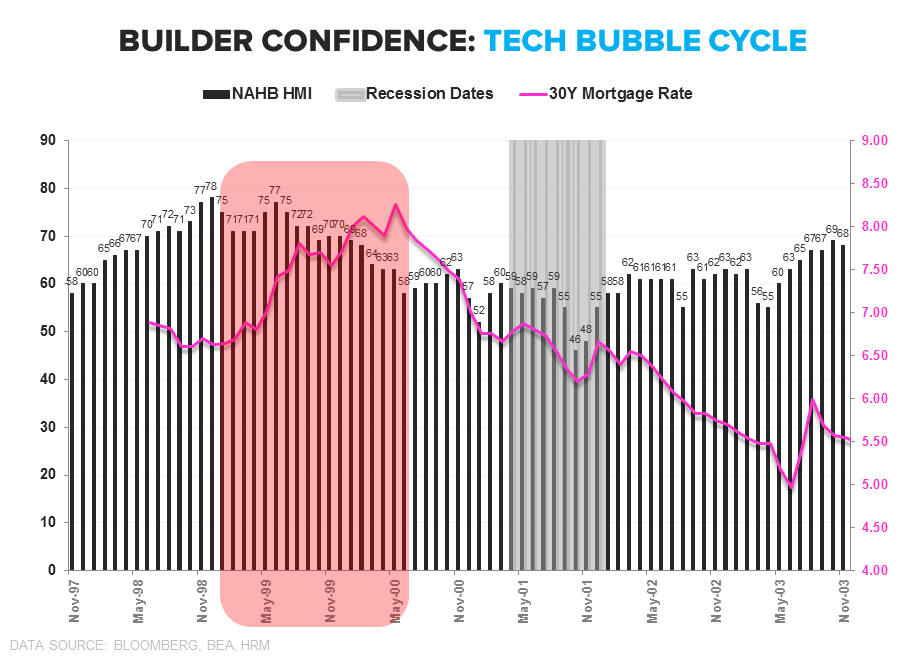
Headfake or Harbinger | Profiling the Last 2 Cycles: The HMI progression followed somewhat variant paths during the Tech and Housing bubbles cycles. We profile each below but there are a few broader takeaways.
- The trend in HMI is a good lead indicator for housing fundamentals and the broader economy and a decent coincident indicator for housing related equities (chart 1 below).
- There are multiple instances in which HMI weakened for 1 or 2 months only to bounce back. However, successive months of weakness have generally signaled further, ongoing softening (chart 2/3).
- Rates: Rates have been a mitigating-to-primary factor in the HMI-Housing connection. Inflections in builder confidence and housing/builder performance have occurred alongside changes in the policy rate and flow through shifts in mortgage financing costs (charts 2/3).
Tech Bubble Cycle (97-03): HMI peaked at 77/78 in Nov/Dec 1998 and then corrected down to 71 for Feb/Mar/Apr 1999, only to bounce back to 75/77 in May/Jun/July 1999. The drop in HMI in late 1998 is fairly coincident with both a tightening in policy and the decline in Housing stocks in early 1999 through mid-2000. However, housing stocks rose steadily from mid-2000 on – a period which coincided with an ease in rates and a stabilizing of HMI in the 55-63 range (post-9/11, notwithstanding).
Housing Bubble Cycle (03-08): In hindsight it was obvious that the June 2005 reading of 72 was the high and it was downhill from there. However, it probably wasn’t clear at that time that things were rolling over (based solely on HMI in isolation) until the 61 print in November 2005, or the 57 print in December 2005. After tripling over the preceding 2.5yrs, builder stocks peaked in July 2005, well ahead of the broader equity or economic peak but coincident with the turn higher in rates.
So what do you do with the November data? …. The short answer is probably ‘not much’ as a single month of data falls in indicator purgatory vis-à-vis a read-through on the Trend. We will be more concerned if we see a 2nd month of retreat in December and the Fed pulls the normalization trigger into slowing growth. The rates dynamic and duration sensitivity in equity exposure is more challenging to navigate in the current instance also as we expect a shallow hiking cycle (if any at all) and think a flattening yield curve is more probable than not in the face of a sustained attempt at policy normalization.


About the NAHB HMI:
The Housing Market Index (HMI) is based on a monthly survey of NAHB members designed to take the pulse of the single-family housing market. The monthly survey has been conducted for 30 years. The survey asks respondents to rate market conditions for the sale of new homes at the present time and in the next 6 months as well as the traffic of prospective buyers of new homes. The HMI is a weighted average of separate diffusion indices for these three key single-family series. The HMI can range from 0 to 100, where a value over 50 implies conditions are, on average, improving, a value below 50 implies conditions are worsening, and an index value of 50 indicates that the housing market is neither improving nor worsening.
Joshua Steiner, CFA
Christian B. Drake
