

It’s hardly a unique line of thought – given the sales weakness across retail -- that KSS is likely to miss or guide down on Thursday. After all, the stock is off 25% since the 2Q print, which in itself was off by yet another 25% decline 13 weeks earlier. While we find it odd that short interest is sitting at 18 month lows, it’s pretty obvious that expectations into Thursday are for a miss. While we share that line of thought, we want to be clear about something…the REAL reason we are short KSS has yet to meaningfully transpire. We have high conviction that this will begin to play out over the next six months, which should result in at least another 25% downside in the stock – for starters.
The REAL Short Case
The real part of the story we think people are missing has to do with KSS Credit, and the dangerously elevated risk that exists regardless of whether the consumer environment or credit cycle weakens. The punchline is that KSS recognizes about $430mm, or 25% of cash flow, in the form of credit income. There’s nothing wrong with that – though people should understand that it is booked as a counter-cost, artificially lowering reported SG&A. In other words, KSS SG&A of $1.6bn is actually over $2bn. That’s about $1.50 per share in earnings associated with credit. At face value, it appears that KSS grew SG&A by a 0.9% CAGR over the past 4 years, but in actuality it grew by 2.3%. A mere 140bps might not seem like much, but it’s rather HUGE for a zero-square footage growth retailer that can’t comp.

That, by itself is nothing more than flagging a part of KSS model that is certainly taken for granted – until the cycle rolls. But our view is that credit income will begin to go down, hence taking up SG&A meaningfully and threatening earnings. Here’s why…
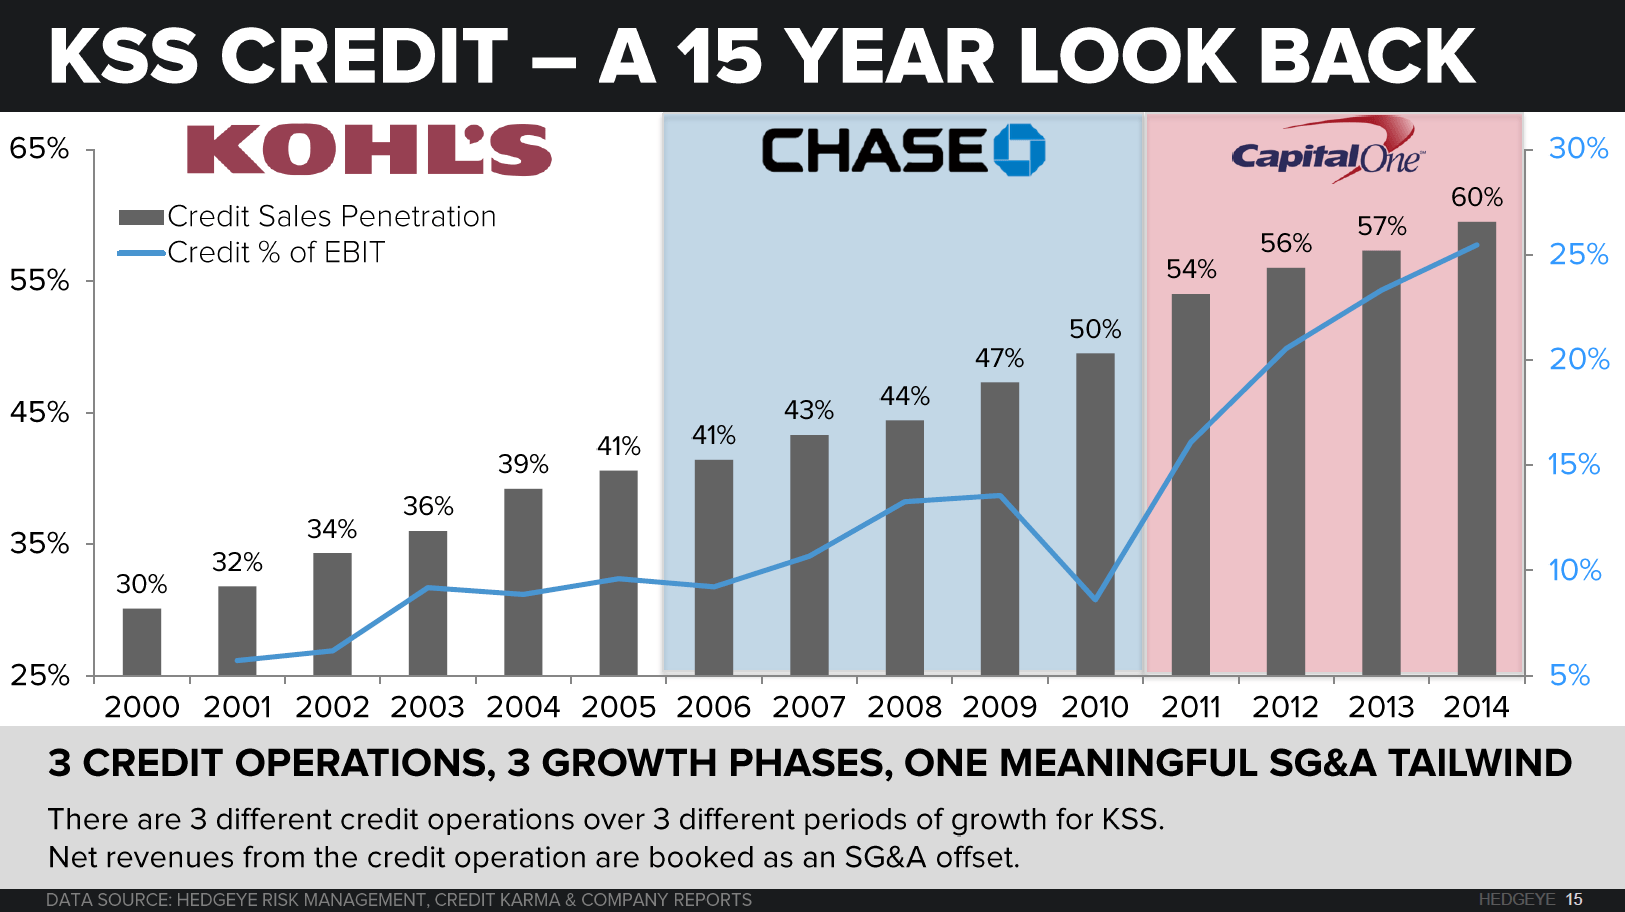
The History of KSS Credit Is Actually A Statement About the Future Growth. Consider the following chain of events (outlined in the chart below).
- Back in 1995, KSS wisely took advantage of a strong environment for proprietary credit by starting the Kohl’s card. Good move.
- Fast Forward to 2006 -- the company sold the credit portfolio to JPM/Chase – another timely move. KSS had only 650 stores at that point, and Chase rode the wave as KSS broadened its footprint to over 1,000 stores – and $250 in credit income for KSS.
- But in 2011 – about the same time KSS meaningfully slowed the growth rate in its footprint, Chase saw its growth rate in this portfolio slow dramatically as KSS hit a wall with customer acquisition. The options were to add more stores to find new customers (impossible), or lower FICO standards to acquire a lesser quality consumer.
- Solution? Switch to Capital One who has ‘easier’ credit standards and was willing to take one lower-quality customers in KSS existing markets. Over the next four years, credit income went up by a full $1.00 per share to nearly $1.50. Again, this represented higher spending by a more marginal consumer as the economic recovery shifted into innings 4 through 8.
- Then, in 2014 the COF partnership hit a wall, and had to either lower consumer credit standards again or find a new party who would underwrite the marginal consumer. That’s when KSS started its own Yes2You rewards plan. This is a non-credit plan, but importantly it offers rewards members similar promotional benefits as if they were Kohl’s Card holders. This is targeted at the people that would not have been approved for the COF card. Again…targeted at people who were not approved for a Capital One Card! Note: the COF agreement is still in place. It simply does not have SSS growth opportunity as it once did.
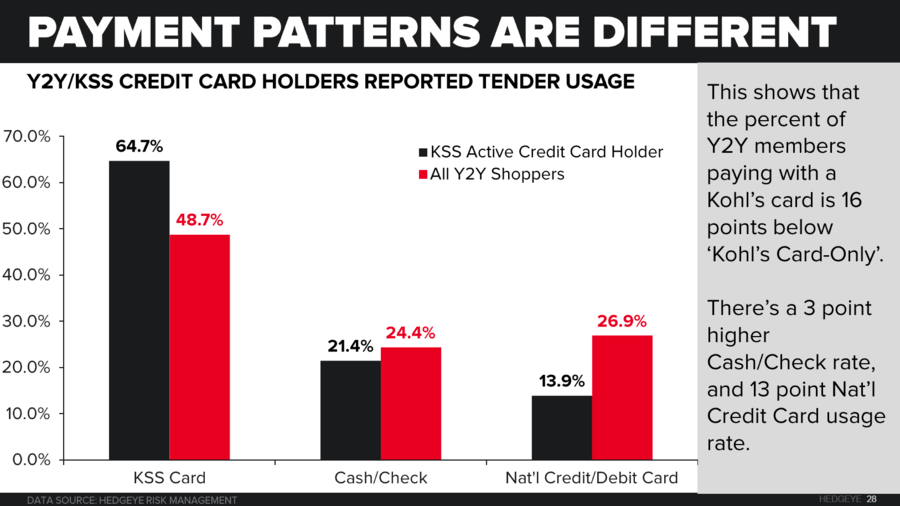
- Our research suggests that there is a high probability of cannibalization. For example, a person who previously got rewards points through buying with the COF/KSS card could now go ahead and buy the same merchandise, get the same discounts, but sap down their Mastercard, Visa, Amex, Diner’s Club…whatever. The sale still shows up on the top line, but no longer is the corresponding credit charge netted against SG&A. There is absolutely no way we can rationalize that this is anything other than #bad for KSS.

This whole ‘cannibalization thing’ is not just theoretical. Our survey work shows that there is a 16 point delta in credit card usage between a KSS card holder and Y2Y rewards member only.
This Was Inevitable
Why would KSS do this? Because it HAD TO. If it’s history of credit partners doesn’t tell the story, then simple penetration math does. Based on our calculations, KSS has already attracted 75% of the potential customer base to its stores every year. We can assure just about anyone that the last 25% costs a lot more to acquire than the middle 50%.

“But KSS Is So Cheap”
Optically, KSS is trading at 10x forward earnings, 5x EBITDA, and a 10% free cash flow yield. Yes, that’s definitely cheap. But that assumes that the Street’s numbers are right. We think they’re off by a wide margin. We think a base-case 2016 number is 20% below the consensus – or $3.90, and a more beared-up number of $2.50 – assuming credit cannibalization, a weaker and more deflationary retail environment, and slight pressure in the base credit business. In this case, KSS is trading at 20x earnings and a 6.5% FCF yield. Hardly ‘cheap’ considering that department stores have traded over 20% FCF yield in past downturns.

Here Are Some Factors to Consider on the Upcoming Quarter
Comps – This stock has gone from high expectations to low expectations in just six months, collapsing by 44% from the April pre-earnings euphoria that KSS would actually put up a 4-5% 1Q comp. Unfortunately for the Bulls, KSS gifted them a 1.5% 1Q comp, and then proceeded to miss 2Q as well (0.1% vs 1.5% expectations).
Consensus comp expectations for the 3rd quarter have come down by 180bps from 2.5% to 0.7% a level that we think is actually very doable in the grand scheme of KSS. Is that enough to make the stock work? Not at a 17x multiple when management was hosting a different investor group every week to bolster expectations like we saw in 1Q. But how bout today with KSS at 9.7x the Street’s NTM estimate? Yes, it probably is – at least over the near term until the street contextualizes the ramp we need to see in the business organically for the company to hit 4Q numbers which calls for a 280bps pop in the 2yr trend line.
Margins – On the margin side there is a lot more good news baked into consensus numbers as we head into 2H. To get to managements guidance (we characterize that as ‘best case’) which calls for 0bps to 20bps of GM improvement and 1.5% to 2.5% SG&A growth for the year and hasn’t been updated since the company reported numbers in February we need to assume the following…
- GM – flat to up 30bps to hit the top end of the range in the face of a) a negative sales to inventory spread of -8% the worst number we’ve seen in 2+yrs, b) bloated inventories across the wholesale channel cited by, VFC, SKX, RL, FINL, NKE, etc., c) a growing dependence on e-comm, though the company no longer reports that number, it’s been the only part of the sales equation actually growing and it comes at a GM 1000bps below a brick and mortar sale, d) rising shipping costs as retailers in this space use ‘free shipping’ as the offensive weapon of choice this holiday season, and e) the 2nd warmest September in history and warmest October since 1963. Remember that the GM leverage guide was predicated on the assumption that inventory would be tightly managed in order to offset e-comm dilution, that’s a much tougher assumption to make in this current environment. Yet, consensus is still modeling 3 years of GM expansion.
- SG&A – growth of 1-3% in 2H to get to the top and bottom end of the guided range which implies slight leverage best case and 35bps of deleverage worst case. With 80% of costs fixed its largely a function of what the company prints on the comp line and how much its able generate through its credit portfolio which we think is tapped and was out comped by non-credit for the first time in recent memory last quarter. That coupled with the rising retail wages this holiday season in the face of a 5% employment rate and wage inflation brought on by the $9.00 minimum wage mandate at two of the three biggest employers in the retail space (WMT & TGT) = a tough comp on the expense line.
