In going through Wayfair’s 3Q and listening to management on the conference call, one question keeps popping up…”why am I short the stock of a company that is growing its core business over 90% and where 44% of its float is held short?” After all, a) the company crushed sales expectations by 14%, and is now larger than (pseudo-competitor) Restoration Hardware, b) almost every operating metric improved on the margin, c) management clearly has a better handle on its business than ever (and absolutely killed it when someone asked about the NYT article about potential legal liability in its flooring business), and d) management set up 4Q expectations for more top line upside.
At face value, that’s pretty tough to beat.
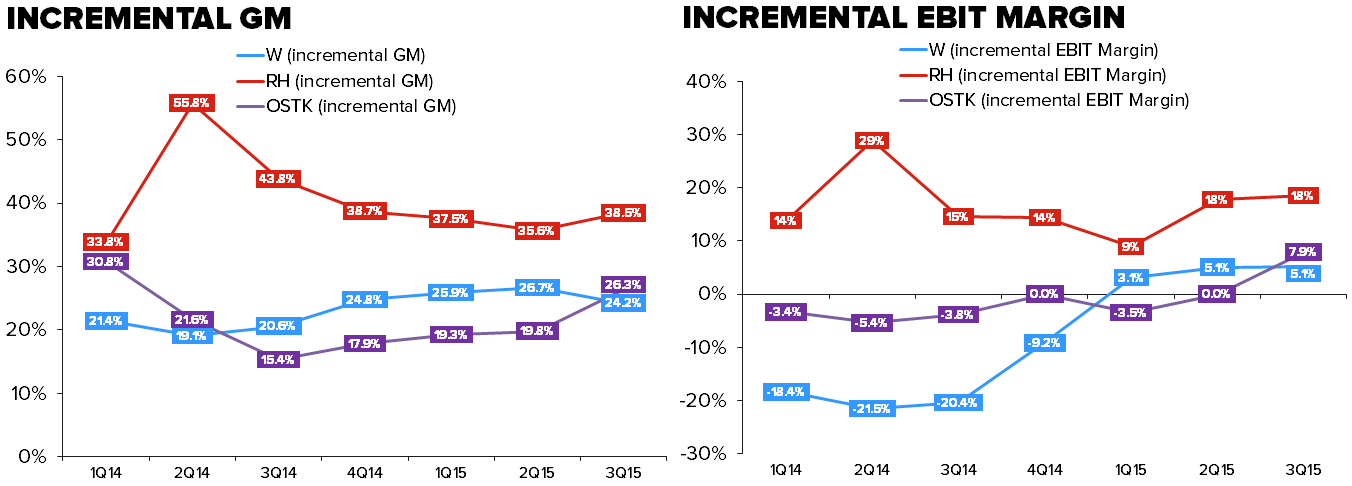
But then we consider the following…a) Wayfair added $266mm in revenue – an astonishing number. But the company still lost money. True, the operating loss narrowed, but only by $13mm. That pegs the company’s incremental margin at only 5.1%. To be clear, companies like Restoration Hardware and Williams-Sonoma – who are consolidating a different end of the home furnishings market (the good end) have incremental flow-through rates of about 20-25%. Heck, even AMZN, which is not afraid to lose money for a very long period of time, has an incremental margin of 15%. Then why are we looking at 5% for W?
The bottom line is that this company is spending – and it’s spending big – around penetrating what management believes to be the company’s TAM. Unfortunately, we think they are overestimating it by a country mile, and are building an infrastructure for growth that will not materialize – at least profitably. It mentioned 5 times the rate at which it’s hiring (390 people in the quarter vs 225 in 2Q). We’re fine with growing headcount, as long as the opportunity is there. But we don’t think it is.
As we’ve been saying, Wayfair has considerably higher penetration in its TAM than people believe. People – including Management, are using numbers like $90bn as an addressable market. That’s just flat-out wrong. We’ve done extensive research on this one, and when all is said and done, we think that the end market is no more than $30bn. To put that into context, it suggests that Wayfair has about 10% share of its market. That’s 2-3x the share of players like RH and IKEA. There’s absolutely no reason why this should be the case. The primary reason is that Wayfair sells furniture and home goods. The purchasing process for a consumer durable like a set of bunk beds, for example, almost always includes in-store visits as well as online research. You get that at Williams-Sonoma, Restoration Hardware, and even Pier 1. But you can’t touch and feel the seven million items sold by Wayfair before you buy. In fact, our research suggests that W’s target consumer has a ‘blind buy’ threshold of around $750. That’s well below the prices listed for furniture sold on its websites.
To be fair, that only applies to furniture, but what about things like lamps, linens, and kitchen utensils? Yes, that’s where we think Wayfair will drive incremental volume, and management seems to agree. But how defendable is it when that product can also be bought online/in-store at Bed Bath & Beyond, Kohl’s and Target? Overall, our work shows that the incremental customer is likely to be much more price sensitive, which not only challenges long term Gross Margin targets, but takes customer acquisition costs higher off a reprieve in 2015. We do think there’s 500bp upside in Order Margins over time, but we need to see 700bp to get Wayfair in the black.
Could Wayfair manufacture a quarter or two in earnings along the way? Probably. But we have an extremely hard time modeling a sustained operating profit – ever.
Here are some callouts from the quarter...
Positives:
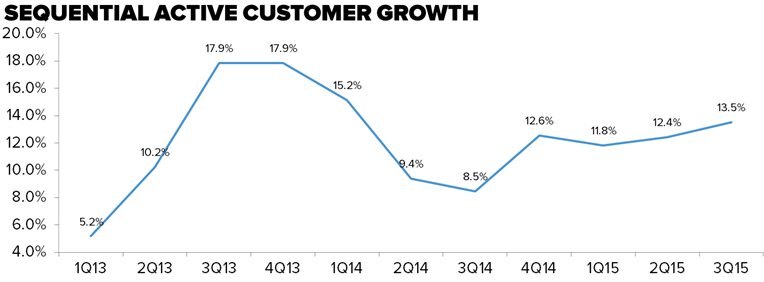
Top Line Ripping – Revenue accelerated to +77% from +66% last Q, improving from 56% to 59% on a 2yr basis. The rapid growth rate has continued in the 4th quarter to date. Growth was being driven by an increase in both the active customer base, better order metrics, and a higher ticket. Sequential customer growth accelerated to +14% from +12%, LTM orders per customer grew 3% yy, and average order value grew 8% which is the best growth seen in Wayfair's reporting history. For two quarters in a row now sequential customer growth and percent of repeat customer orders have accelerated, which can be attributed to a lower churn rate.

Ad Leverage – Even as the company expands its TV advertising campaign W posted massive advertising leverage of 290bps yy to 11.9%. This paired with accelerating customer growth drove the company's customer acquisition cost down 4% yy. But, we still need to see 400bps of leverage to get to company's LT target of 6-8% advertising margin. The flywheel is easy to spin when the company is growing its direct revenue base at 90%, but how about when the top line slows to a 20% rate as brand awareness peaks out and market share gets harder to capture?

Rebounding Cohort Spend – W’s updated cohort analysis indicates spending has improved in the last 2 years for old cohorts (2011 & 2012) that had previously appeared to flatline. This implies the company was either able to re-engage customers which had drifted away from the brand, or that loyal customers have accelerated their spending. Either way an upward trend on these lines is needed to prove the long term viability of the model since the contrary would mean previous customers and revenue were lost forever.

Negatives:
Wayfair as an everyday store? That’s how the company justifies its 60mm household addressable market targets. But, let’s be clear about one thing, Wayfair is a Specialty Store that happens to sell 7mm+ SKUs in the home furnishing space. The comparison to a retailer like WMT and TGT is flawed in so many ways, but the most obvious fact is that the average Walmart shopper makes 25+ visits to the store per year, and the average Target shoppers makes 12+ (per our survey data), and that doesn’t count the number of visits/purchases transacted online. The average Wayfair shopper makes only 1.7 orders per year. For a category as event driven as Home Furnishings where the replacement rate is amongst the lowest in retail (especially for the big ticket items) we have a hard time getting comfortable with that logic. If W is going to deliver on its ‘everyday store’ promise it will be in categories like lamps, linens, and kitchen utensils, and that’s not a competitive set that we’d want to be going head to head with.
Brand Awareness and TAM – aided brand awareness by the company’s measure hit 67% during the quarter. That’s up from 55% in 4Q14, 52% in 3Q14, and 36% from 4Q13. Why has the revenue base doubled in 2yrs, look no further than this metric. We can’t argue with the trajectory of the W top line, especially after a quarter in which it reported 91% direct revenue growth. But, now the company will have to prove its mettle in a market that it a) already has 10%+ share of and b) has far less low hanging fruit now that the consumer knows what wayfair.com actually is.
Incremental Margin – Wayfair added an incremental $266mm in revenue during the quarter but only $13mm in operating profit. Need any indication of how much it will cost W to continue to keep the top line spinning? Look at the comparison to RH and OSTK who will/have revenue growth of 14% (estimate) and 11%, respectively in 3Q15. OSTK obviously has a much more mature model than W, but RH is at a similar stage of its growth cycle as it reinvents its store base, and consolidates a fragmented part of the market. The only difference is that RH is putting up industry leading operating margins this year on its way to the mid-to-high teens.