
I contextualized a lot of the current labor market dynamics in this morning’s Early Look (HERE), I touch on the incremental below.
The payroll data for October was strong across the board: Headline NFP & Private Payroll gains, Hourly Earnings, Unemployment/Underemployment Rate (with healthy internals), Positive Sector Hiring Breadth, Employment mix were all better sequentially.
The Fundamental Read-Through | Here’s what the prevailing narrative will be in the wake of the October data:
At 5% Unemployment, the domestic labor market is now at or flirting with full employment and, with wage growth making a new cycle high at +2.5%, has finally reached some critical threshold whereby that tightness is beginning to manifest in higher earnings growth
Conventionally, wages are viewed as a lagging indicator, with wage inflationary pressure building as the labor supply declines and the economy moves towards constrained capacity.
The intuition is straightforward: ↓ Supply + ↑/Stable demand = ↑Prices …. as the labor market tightens (supply goes down) and job openings and hires remain solid (demand), the price of labor rises.
That line of thinking is commonsensical and the core of the slack debate has centered on the magnitude of the shift in labor supply-demand dynamics and whether policy should move ahead of or behind any emergent inflationary curve in service of their dual mandate.
The problem of the last 3 decades, however, has been that, by and large, there has been no inflation curve. The conventional output-inflation loop in which rising wage growth drives demand pull inflation which drives an acceleration in broader inflation has been almost non-existent over the last 3 cycles.
Even with the inflationary cocktail of peak demographics, peak productivity growth, peaking leverage, asset price bubbles and positive interest rate cycle dynamics coming in-phase in the late 90’s and mid-2000’s core PCE inflation failed to rise much above 2%.
The bearish/dovish re-joinder to the above is that on a Trending basis payroll growth is slowing, a growing list of lead indicators have moved past peak, the preponderance of domestic and global macro data has slowed in recent months, inflation is not an emergent threat, the Aug/Sept Employment figures were more reflective of the underlying reality and October was the outlier. Time will be the arbiter.
On Wage Growth: Wage growth for production and nonsupervisory employees (~80% of the labor force) was +2.3%, below the private sector average of +2.5% so the improvement was broad based but still disproportionately going to the top quintile.
Is a return to a halcyonic 4-4.5% level of nominal wage growth of prior cycles (see chart below) in the face of persistently lower inflation, an aging workforce, top heavy demographics, lower productivity and lower credit growth a reasonable expectation?
Probably not. Could we accelerate to +3.0%? … sure, I suppose, but know that you’re (maybe) playing for something like ~50 bps and wage growth peaks at the very tail end of the expansion.
Income & Consumption Read-through: Consensus growth expectations continue to rely almost singularly on consumption expenditures and income growth anchors the capacity for consumption growth. The acceleration in aggregate hours worked + acceleration in hourly earnings will = re-acceleration in aggregate income in Oct (reported 11/25).
The slope of household spending growth will hold modestly negative (off the 1Q15 peak) but will remain “good” on an absolute basis to start 4Q, particularly if the savings rates stays static at current levels.
The Market Read-Through: #DeflationRisk
The Dollar, Yields, and Fed Fund futures which had already been discounting the rhetorically hawkish FOMC commentary all appear to be pricing-in the final price-in of a December hike. And there's a month of data and another employment report to digest before that policy trigger pull.
A correction in equities alongside an attempt at policy normalization would not be surprising. After all, if QE = ↓ Yields = ↓ Discount Rate = ↑ Present values, the converse should hold in some measure as well.
Notably, if you look at the Shadow Fed Funds Rate – which attempts to translate unconventional policy initiatives into Fed Fund equivalents – we have been in a rising rate environment since April, 2014 and the effective Fed Funds rate has risen ~225 bps to -0.75% from -3%. From a rate of change perspective, the macro data has slowed concomitantly.
Strong $USD: A policy induced strong dollar only perpetuates global deflation risk. Global Inflation expectations are priced in dollars (as are the Trillions in $USD denominated EM debt) and further dollar strength will only exacerbate the OUS growth and inflation challenges faced by foreign central banks. The U.S. will continue to import that deflation on the back end and the industrial and earnings recessions we’ve witnessed the last two quarters domestically will persist.
Sustained domestic de-coupling is a sirenic concept but deflation's dominoes follow a winding path. The last domino is still a domino.
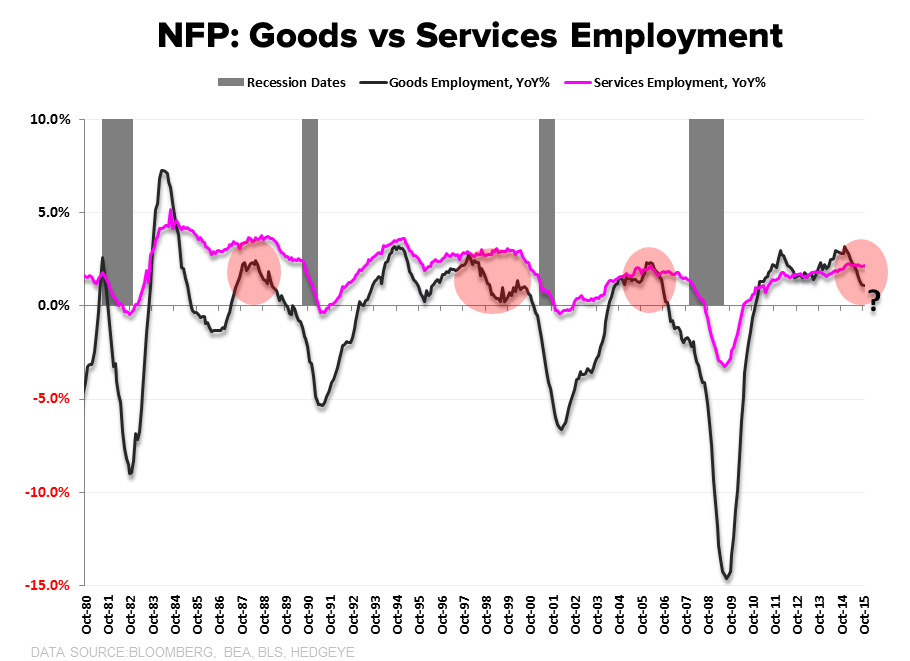
A visual tour of the Employment data is below.


Christian B. Drake
@HedgeyeUSA
