

Investment Company Institute Mutual Fund Data and ETF Money Flow:
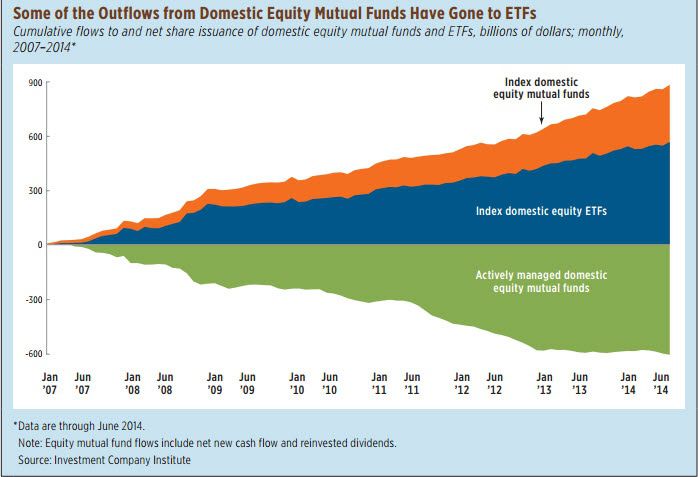
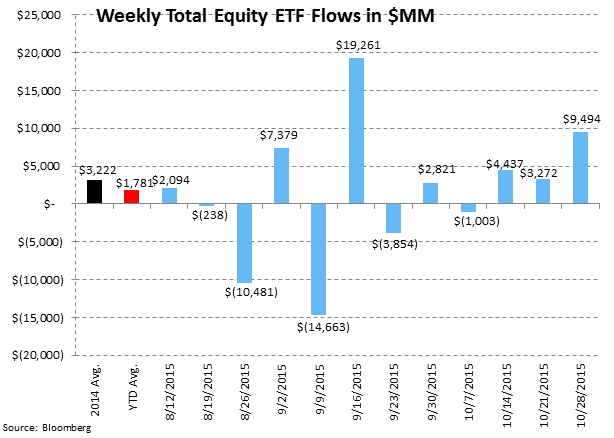
In the 5-day period ending October 28th, investors flocked to equity ETFs inserting +$9.5 billion in passive stock products, the third largest weekly contribution this year. Conversely, active equity mutual funds continue to be the source of funds, with another -$2.8 billion being redeemed from all U.S. stock fund managers. This shift from active to passive has been rolling for almost a decade now however with still over $7 trillion in active equity mutual funds versus $1.6 trillion in U.S. equity listed ETFs, there is still plenty of market share to be gained. The chart below outlines that the -$595 billion in redemptions in U.S. mutual funds since 2007 has resulted in +$855 billion in new inflow into all passive products (index mutual funds and ETFs). This trend has continued throughout 2015 with a -$125 billion redemption in active U.S. mutual funds versus the +$88 billion subscription to U.S. ETFs. We recommend a short position in shares of T. Rowe Price as a way to express this ongoing shift (see our TROW reports).
Cash continues to build on the sidelines as well as of the most recent survey with another +18 billion recorded by ICI in cash products as of October 28th. Money funds have now brought in +$48 billion in the fourth quarter to date, following a $67 billion build in the third quarter. In addition, the news of Bank of America transferring its +$80 billion money fund portfolio to BlackRock could be a trend to come as banking organizations start to move pools of assets that trigger capital charges under forming rule sets. We continue to like the cash management space and out of favor Federated Investors (see our FII report) on a combination of positive balance builds and profitability inprovements in the business for '16/'17.
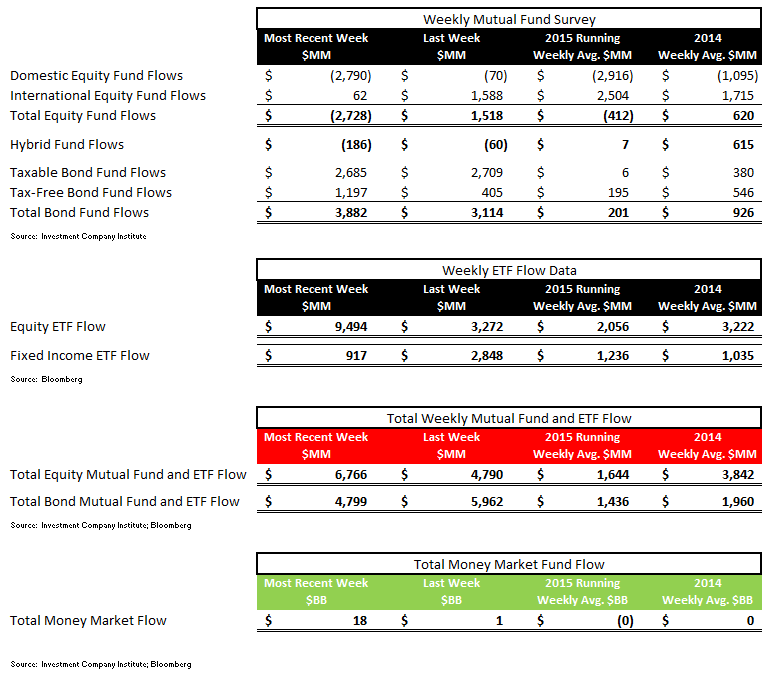
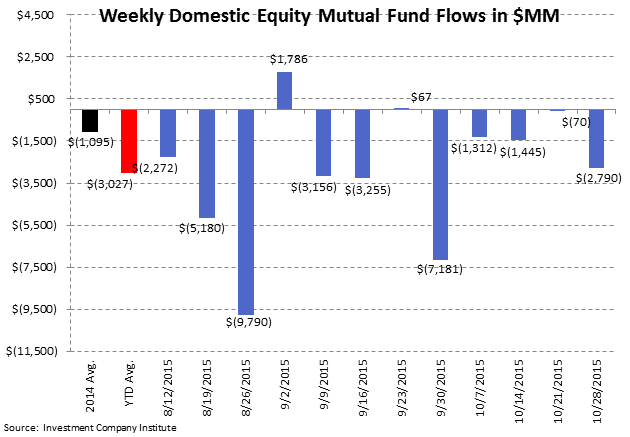
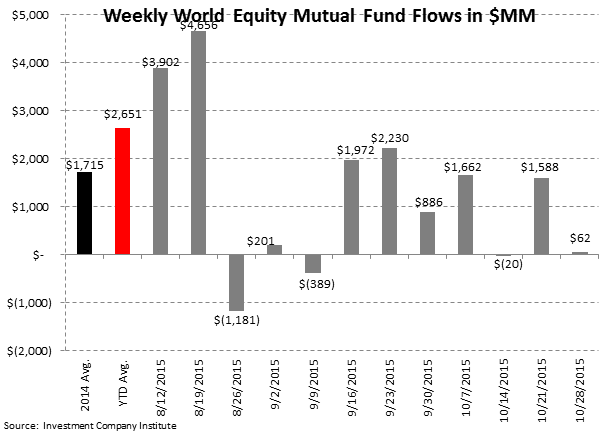
In the most recent 5-day period ending October 28th, total equity mutual funds put up net outflows of -$2.7 billion, trailing the year-to-date weekly average outflow of -$412 million and the 2014 average inflow of +$620 million. The outflow was composed of international stock fund contributions of +$62 million and domestic stock fund withdrawals of -$2.8 billion. International equity funds have had positive flows in 46 of the last 52 weeks while domestic equity funds have had only 9 weeks of positive flows over the same time period.
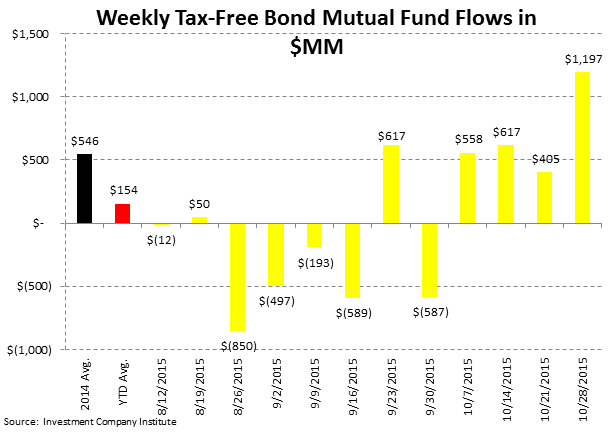
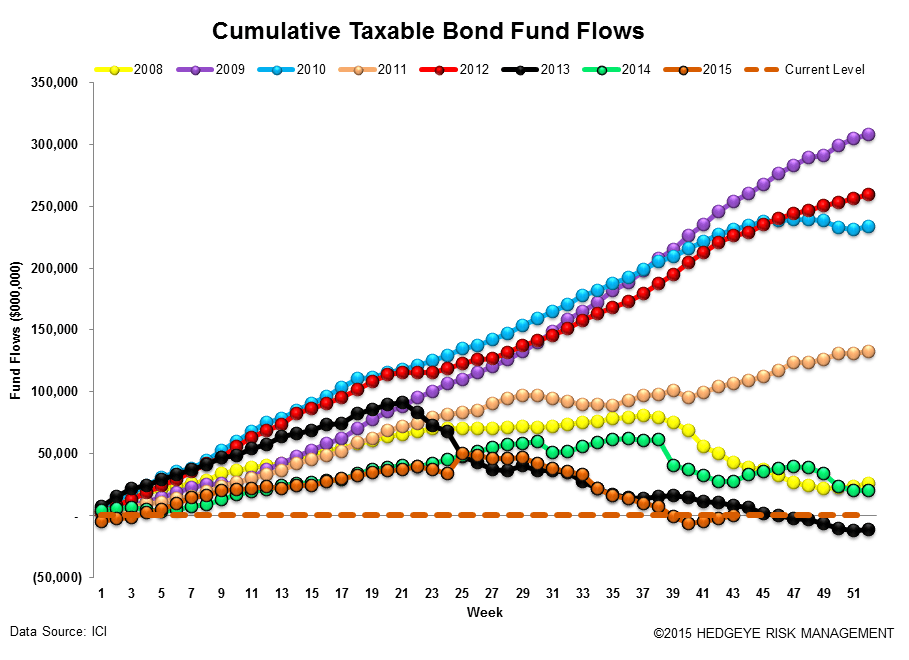
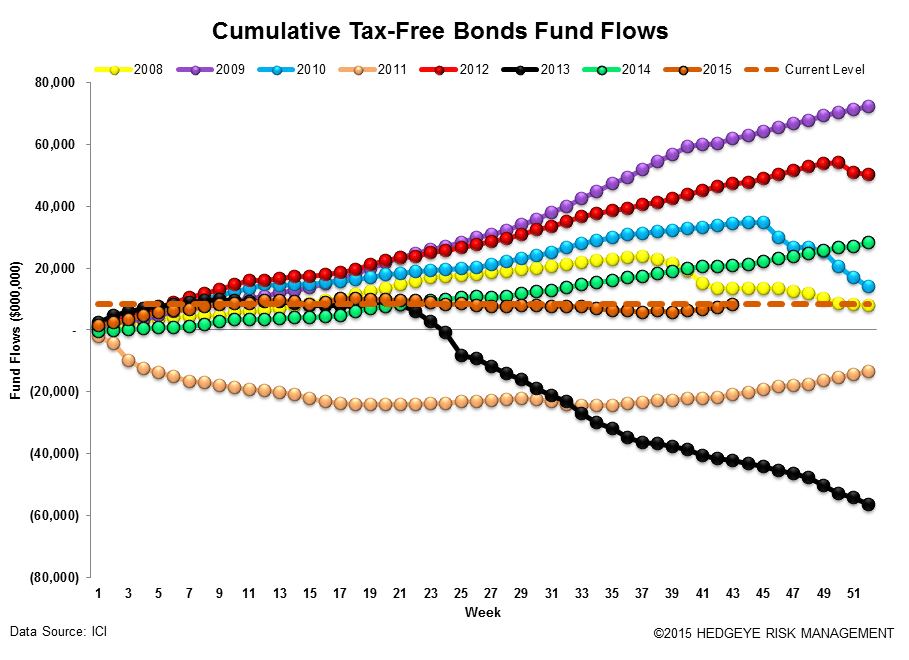
Fixed income mutual funds put up net inflows of +$3.9 billion, outpacing the year-to-date weekly average inflow of +$201 million and the 2014 average inflow of +$926 million. The inflow was composed of tax-free or municipal bond funds contributions of +$1.2 billion and taxable bond funds contributions of +$2.7 billion.
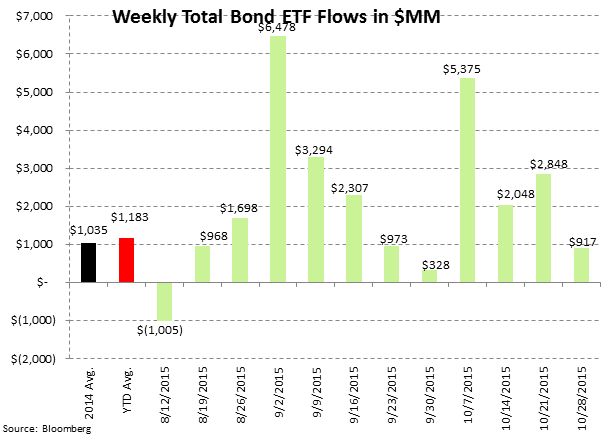
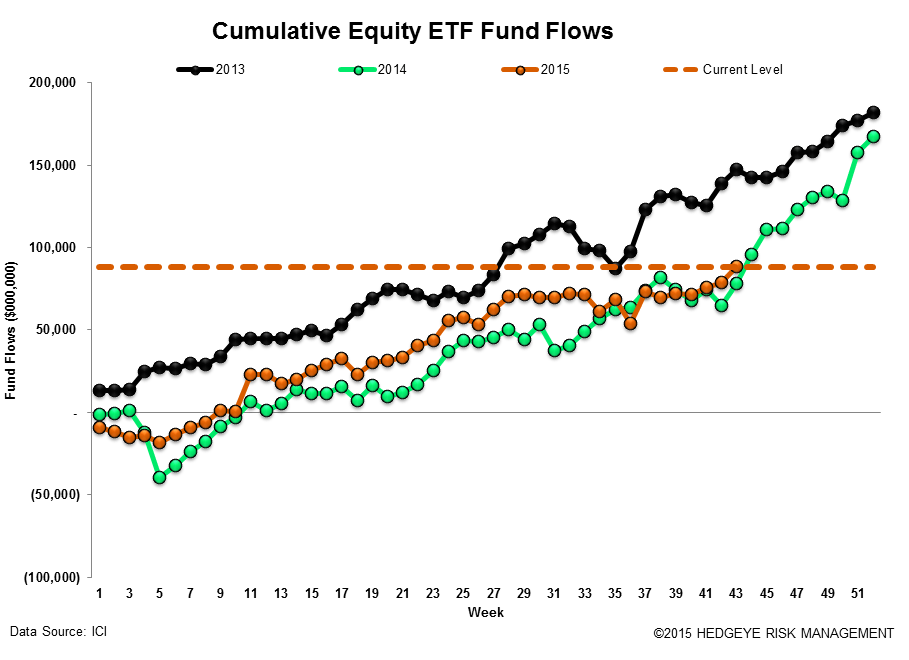
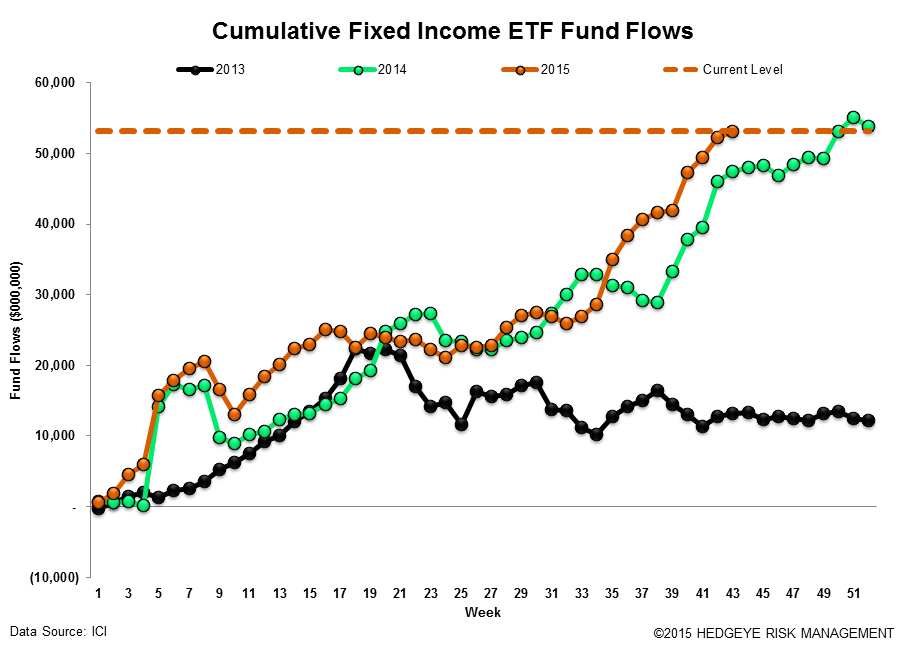
Equity ETFs had net subscriptions of +$9.5 billion, outpacing the year-to-date weekly average inflow of +$2.1 billion and the 2014 average inflow of +$3.2 billion. Fixed income ETFs had net inflows of +$917 million, trailing the year-to-date weekly average inflow of +$1.2 billion and the 2014 average inflow of +$1.0 billion.
Mutual fund flow data is collected weekly from the Investment Company Institute (ICI) and represents a survey of 95% of the investment management industry's mutual fund assets. Mutual fund data largely reflects the actions of retail investors. Exchange traded fund (ETF) information is extracted from Bloomberg and is matched to the same weekly reporting schedule as the ICI mutual fund data. According to industry leader Blackrock (BLK), U.S. ETF participation is 60% institutional investors and 40% retail investors.
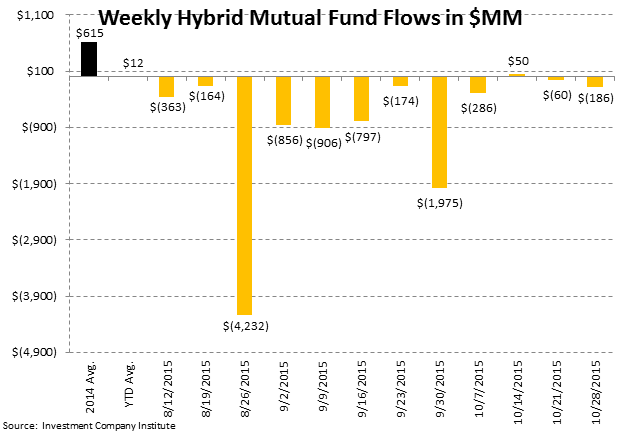
Most Recent 12 Week Flow in Millions by Mutual Fund Product: Chart data is the most recent 12 weeks from the ICI mutual fund survey and includes the weekly average for 2014 and the weekly year-to-date average for 2015:

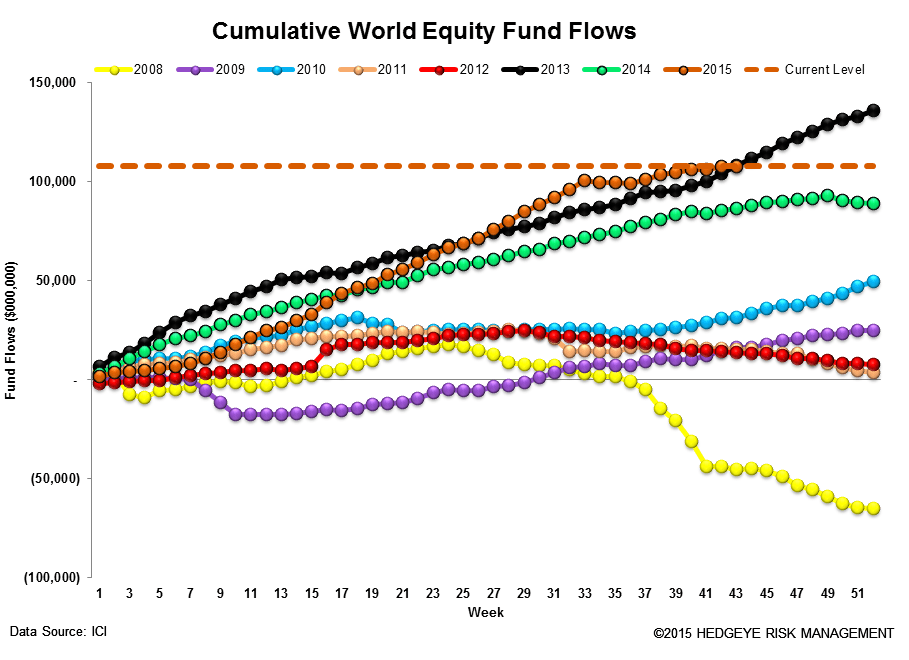
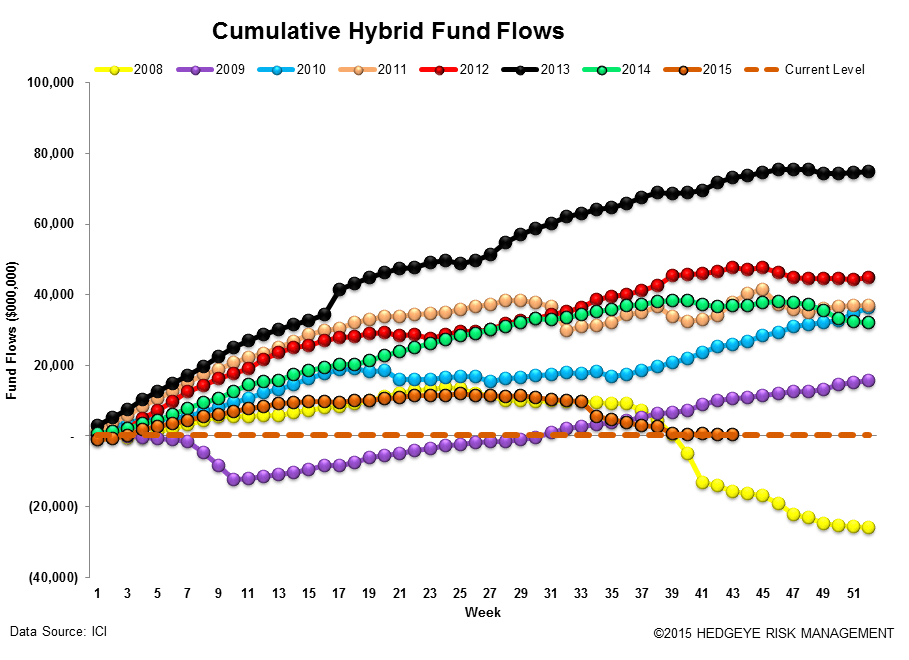
Cumulative Annual Flow in Millions by Mutual Fund Product: Chart data is the cumulative fund flow from the ICI mutual fund survey for each year starting with 2008.

Most Recent 12 Week Flow within Equity and Fixed Income Exchange Traded Funds: Chart data is the most recent 12 weeks from Bloomberg's ETF database (matched to the Wednesday to Wednesday reporting format of the ICI), the weekly average for 2014, and the weekly year-to-date average for 2015. In the third table are the results of the weekly flows into and out of the major market and sector SPDRs:
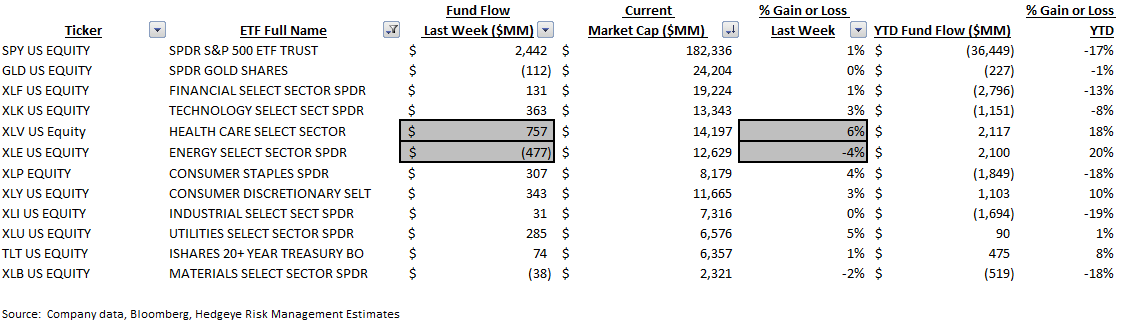
Sector and Asset Class Weekly ETF and Year-to-Date Results: In sector SPDR callouts, the healthcare XLV ETF took in +6% or +$757 million in contributions. The energy XLE on the other hand lost -4% or -$477 million.
Cumulative Annual Flow in Millions within Equity and Fixed Income Exchange Traded Funds: Chart data is the cumulative fund flow from Bloomberg's ETF database for each year starting with 2013.
Net Results:
The net of total equity mutual fund and ETF flows against total bond mutual fund and ETF flows totaled a positive +$2.0 billion spread for the week (+$6.8 billion of total equity inflow net of the +$4.8 billion inflow to fixed income; positive numbers imply greater money flow to stocks; negative numbers imply greater money flow to bonds). The 52-week moving average is +$1.4 billion (more positive money flow to equities) with a 52-week high of +$27.9 billion (more positive money flow to equities) and a 52-week low of -$19.0 billion (negative numbers imply more positive money flow to bonds for the week.)

Exposures: The weekly data herein is important for the public asset managers with trends in mutual funds and ETFs impacting the companies with the following estimated revenue impact:

Jonathan Casteleyn, CFA, CMT
Joshua Steiner, CFA
