Our Hedgeye Housing Compendium table (below) aspires to present the state of the housing market in a visually-friendly format that takes about 30 seconds to consume.

Today's Focus: September CoreLogic Home Price Report
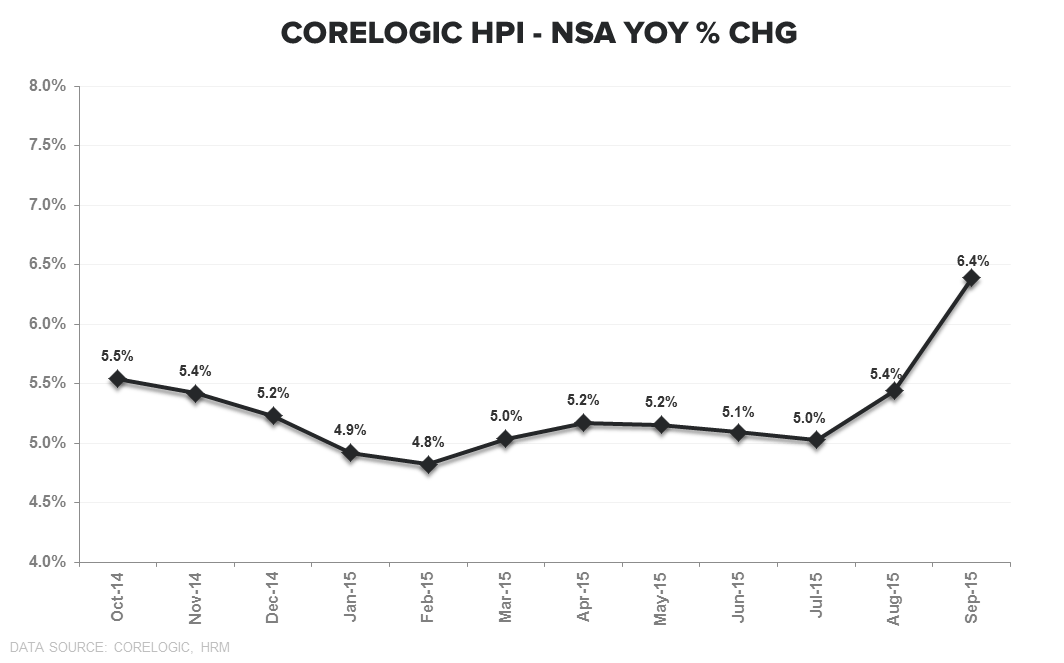
CoreLogic HPI: Over the last year, the CoreLogic HPI series – which has historically been the best, most real-time price series – has shown an alarming trend toward imprecision and overestimation.
The 1st chart below shows the revisions to the Jul/Aug data. Alongside the September release, August was revised lower by -150bps from +6.9% YoY to +5.4%. July, meanwhile, was revised lower for a second time with a revision of -70bps taking price growth down to +5.0% YoY. Price growth in July was originally estimated at +6.9% YoY, so the collective revision of the last two months has brought that down by almost a full -200bps.
And this revision pattern is not isolated to the September release – the serial overestimation in the original estimate followed subsequently by large-scale negative revisions has characterized the pattern every month YTD.
The revision is not inconsequential as it effectively (almost) changes the read-through. Whereas the original estimate has reflected conspicuous acceleration and a positive read-through for housing related equities, the revision to flat-to-modest HPI carries a less bullish read-through for the complex. In fact, the collective revision to July shows HPI decelerating modestly in the month and completely reverses the HPI-Equity Performance conclusion.
Further, historically, CoreLogic has been a very good lead indicator for the Case-Shiller HPI series, front-running the slope of HPI in Case-Shiller by 2-3 months. That lead indicator status has become increasingly suspect given the prevailing revision pattern.
Inclusive of the apparent methodological flaw in the CoreLogic series, the three primary price series (CoreLogic, FHFA, Case-Shiller) continue to tell a largely congruous story of flat-to-modestly accelerating HPI. We’re going to call CoreLogic to see if we can get some tangible underpinning for the serial overestimation in the data. We’ll report back with anything of consequence.


About CoreLogic:
CoreLogic HPI incorporates more than 30 years worth of repeat sales transactions, representing more than 55 million observations sourced from CoreLogic's property information database. The CoreLogic HPI provides a multi-tier market evaluation based on price, time between sales, property type, loan type (conforming vs. nonconforming), and distressed sales. The CoreLogic HPI is a repeat-sales index that tracks increases and decreases in sales prices for the same homes over time, which provides a more accurate constant-quality view of pricing trends than basing analysis on all home sales. The CoreLogic HPI covers 6,208 ZIP codes (58 percent of total U.S. population), 572 Core Based Statistical Areas (85 percent of total U.S. population) and 1,027 counties (82 percent of total U.S. population) located in all 50 states and the District of Columbia."
Joshua Steiner, CFA
Christian B. Drake