

Weekly Activity Wrap Up
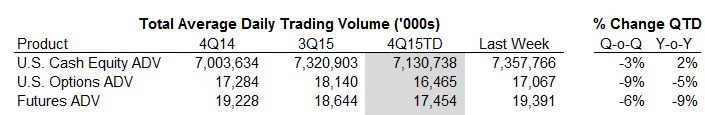
All three categories remain in negative growth territory Q/Q, although cash equities, with a 7.1 billion 4Q15TD ADV, are positive Y/Y at +2%. Options activity is averaging 16.5 million contracts per day so far in the quarter, a -5% contraction year-over-year and a -9% contraction versus 3Q15. Futures had their best week so far this quarter, coming in with 19.4 million contracts per day, however, the 17.5 million 4Q15TD ADV is -6% lower than last quarter and -9% lower than 4Q14. In October of last year, the potential Greek exit from the European Union drove outsized activity which will have normalized by mid-November. We expect both ICE and CME to have better comps at that point and think that CME especially will finish 2015 strongly (see our most recent CME note here).
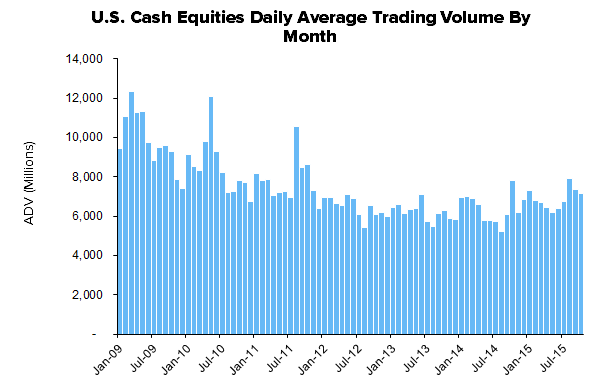
U.S. Cash Equity Detail
U.S. cash equity trading came in at 7.4 billion shares traded per day this week. That brings the fourth quarter average to 7.1 billion shares traded per day, a +2% Y/Y expansion but -3% Q/Q contraction. The market share battle for volume is mixed. The New York Stock Exchange/ICE is taking a 24% share of fourth-quarter volume, a +3% year-over-year increase, while NASDAQ is taking a 19% share, a -8% year-over-year decline.


U.S. Options Detail
U.S. options activity came in at a 17.1 million ADV this week, bringing the 4Q15TD average to 16.5 million, a -5% Y/Y and -9% Q/Q contraction. The market share battle amongst venues continues to be one of losses at the NYSE/ICE, which has lost -9% of its share year-over-year settling at just 18% of options trading currently. Additionally, CBOE's market share has been falling recently and now sits at 26%, -14% lower than 4Q14. NASDAQ, on the other hand, is starting the quarter strongly, increasing its market share by +13% compared to 3Q15, bringing itself only -2% lower than the 24% share it held a year ago. BATS' share has been falling recently but at 8% in 4Q15TD it remains +27% higher than in 4Q14. Finally ISE/Deutsche's 15% share in 4Q15TD remains consistent with 3Q15, which brings it to +10% Y/Y growth.


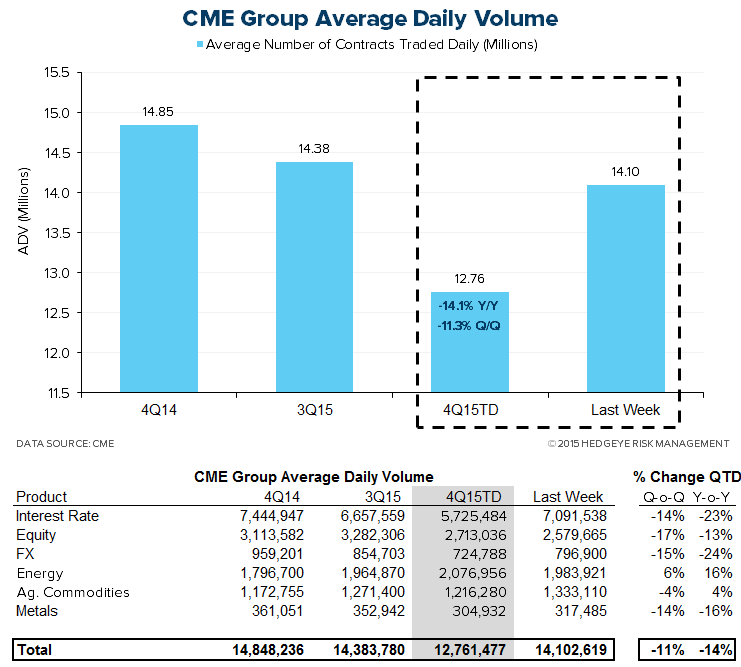
U.S. Futures Detail
CME Group volume came in this week at 14.1 million contracts per day and is averaging 12.8 million for the fourth quarter, a -14% Y/Y and -11% Q/Q contraction. However, CME open interest, the most important beacon of forward activity, currently tallies 101.7 million CME contracts pending, good for +9% growth over the 93.7 million pending at the end of 4Q14, an expansion from the prior week's +7%.
ICE had its best week so far in 4Q15TD with 5.3 million contracts traded per day. Additionally, at 4.7 million contracts traded per day in 4Q15TD, activity has grown +7% Y/Y and +10% Q/Q. ICE open interest this week tallied 67.5 million contracts, a +14% expansion versus the 59.4 million contracts open at the end of 4Q14, consistent with the prior week.


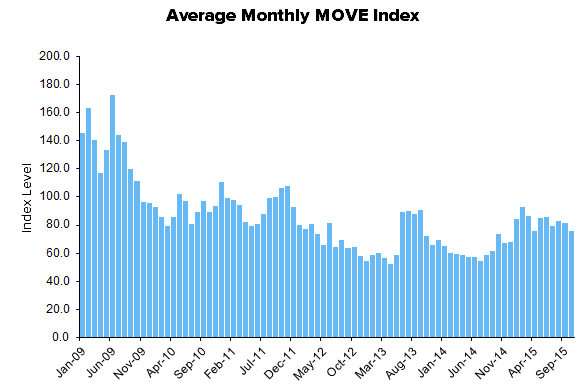
Monthly Historical View
Monthly activity levels give a broader perspective of exchange based trends. As volatility levels, measured by the VIX, MOVE, and FX Vol should rise to normal levels after the drastic compression this cycle, we expect all marketplaces to experience higher activity levels.


Sector Revenue Exposure
The exchange sector has broadly diversified its revenue exposure over 10 years as public entities with varying top line sensitivity to the enclosed trading volume data. The table below highlights how trading volumes will flow through the various operating models at NASDAQ, CME Group, ICE, and Virtu:

Please let us know of any questions,
Jonathan Casteleyn, CFA, CMT
Joshua Steiner, CFA
