Editor's note: This is an excerpt from today's Early Look written by Hedgeye CEO Keith McCullough, in which he recaps last week's market gyrations after ECB President Mario Draghi effectively devalued the euro.
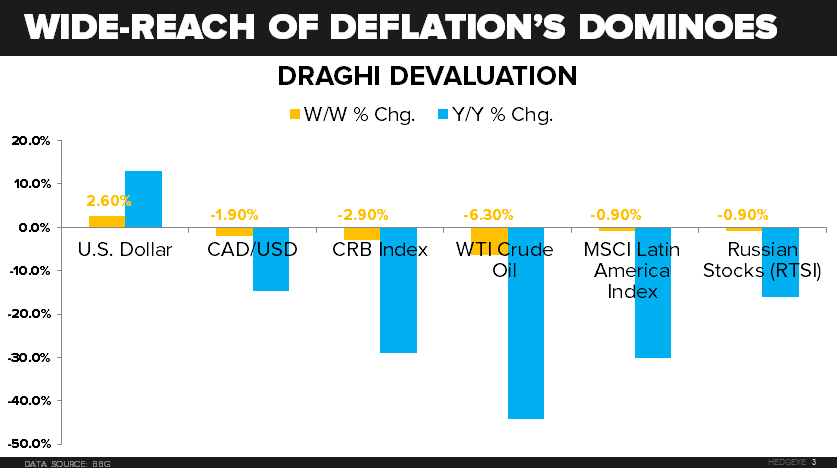
On a week-over-week basis, with Draghi Devaluing the Euro -2.9% (vs. USD) here’s what happened in Global Macro markets:
- US Dollar Index ripped at +2.6% weekly gain, taking it to +7.5% YTD and +13.1% year-over-year
- Canadian Dollars deflated another -1.9% week-over-week to -11.7% YTD and -14.7% year-over-year
- Commodities (CRB Index) got tagged for a -2.9% #deflation on the week, -15.8% YTD, and -28.9% year-over-year
- Oil (WTIC) deflated another -6.3% week-over-week, crashing -24.8% YTD, and -44.1% year-over-year
- Copper deflated -2.3% on the week, taking it to -17.0% YTD, and still in crash mode -22.5% year-over-year