Our Healthcare Team has developed the Macro Monitor, a web-based tool for identifying relationships across thousands of data sets. They have since expanded the Macro Monitor to include restaurant related macro and company fundamental time series. We started the process several months ago and have identified several relationships that we think are interesting and worth tracking over time. Our plan of action is to continue to build out our data sets and capabilities using the Macro Monitor and come out with additional high frequency trackers that provide a read into the company’s fundamentals. This note represents our first tracker, THE DONUT TRACKER, right now we are using it to focus on DNKN, but will expand it to KKD in the near future.
DNKN is a name that we track very closely. That being said, it has not been on the immediate radar screen, but it is moving up the list. The business model is enviable, but only if they are generating positive same-store sales. Same-store sales for DNKN are important, but only as a leading indicator for future development.
With the company making $0.02-$0.03 in EPS on every new store opened, development is crucial to the overall DNKN story. Once same-store sales trends turn negative the development pipeline will begin to slow down as franchisees will not want to open up stores at the same rate.
ADDING IT TO THE SHORT BENCH
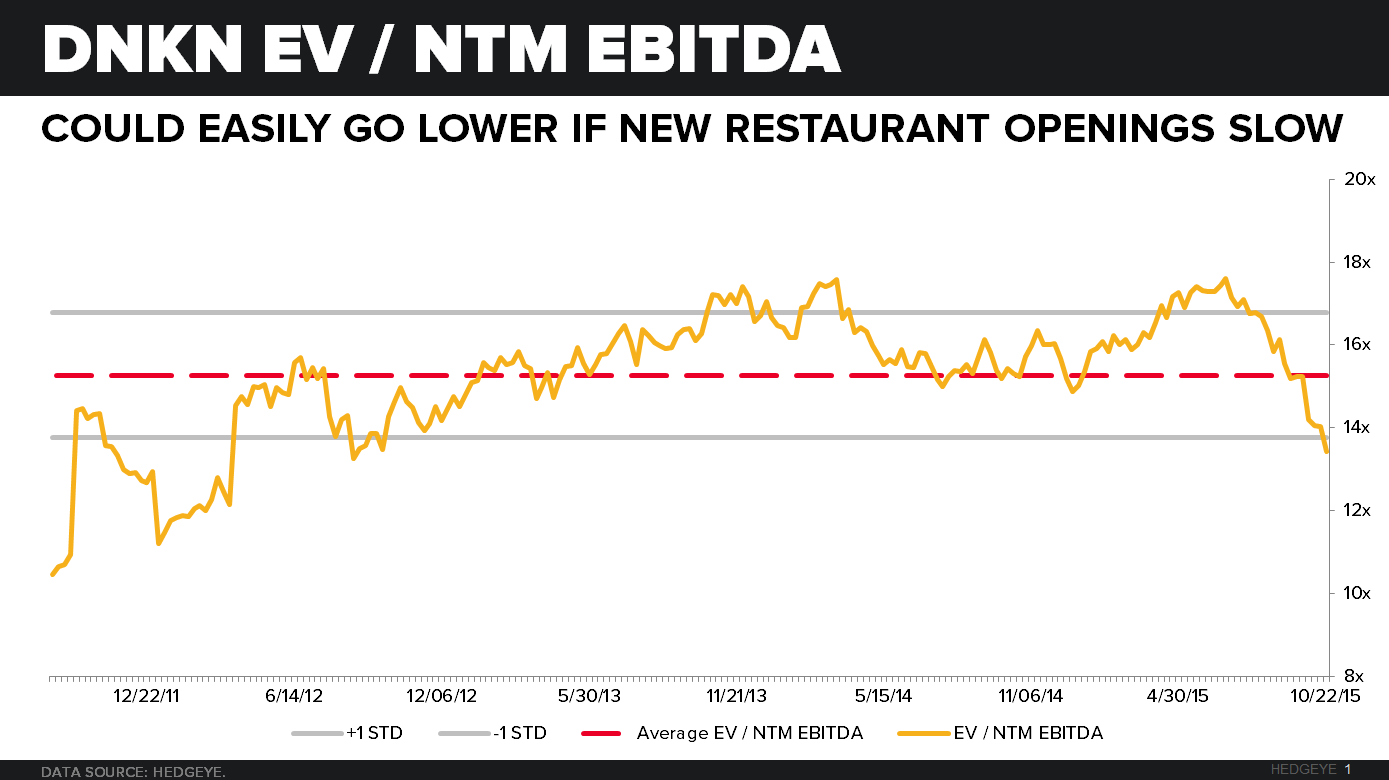
In this context, at 13.4x EV / NTM EBITDA the stock is overvalued. As a result, we are adding DNKN to the Hedgeye Restaurants Best Ideas list as a SHORT, but on the BENCH for now.

The company has guided to 1-3% same-store sales growth for 2015 and 2-4% over the next five years. Same-store sales are currently tracking at the low end of expectations. In 2015, they will open 410-440 total net units (excluding the speedway closures). Over the next five years they will grow units 4-6% versus 5.1% and 5.3% in 2013 and 2014, respectively.
Given the current trends in same-store sales over the past three years and the increased competition, DNKN sales trends are under pressure. No question DNKN will be one of the companies that will be impacted by a resurging McDonald’s.
THE DONUT TRACKER
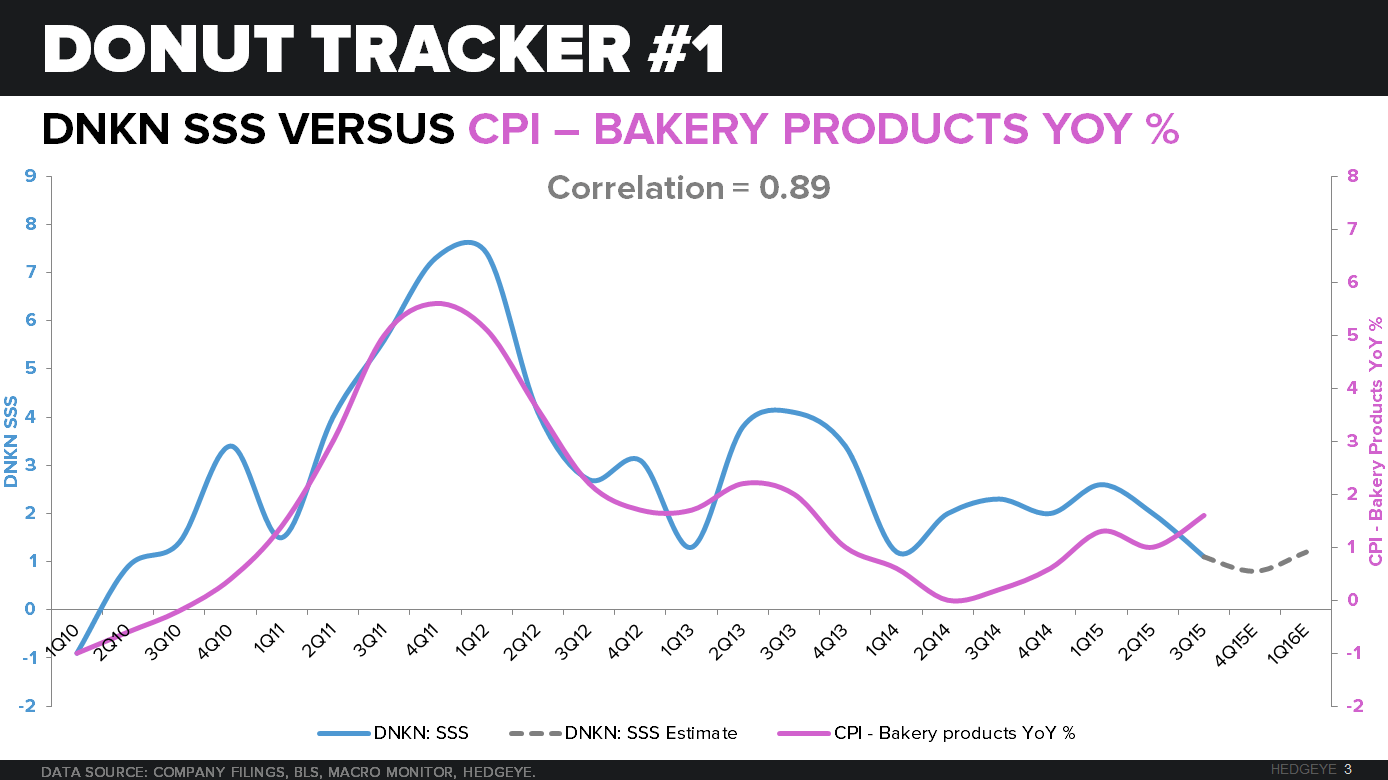
Given the size of the DNKN system it will be difficult to get a good read on system same-store sales by talking just to franchisees. In addition to our conversations, we will be looking to other sources of data to indicate how sales trends are faring. Over the past year we have tracked a number of other reliable indicators that show a strong correlation to DNKN quarterly same-store sales.
Consumer price index (CPI) and producer price index (PPI) information provided by the Bureau of Labor Statistics (BLS) has proven to be a good indicator of the overall trend for DNKN. Below we provided four charts out of the 6-8 that are working well since we started to track them. CPI – Bakery Products YoY % is the tightest, and most relevant correlation to DNKN SSS at a 0.89 correlation. We find this to be very indicative of performance given its strong relevance to DNKN and the tight correlation over the last five years.
With these indicators being reported monthly we can get a strong sense of how sales are trending intra-quarter. We will be using these data sets in order to get a read on the trend and what to expect from DNKN. In addition, we will monitor menu changes and quarterly LTO’s to gauge how the company is managing the business.


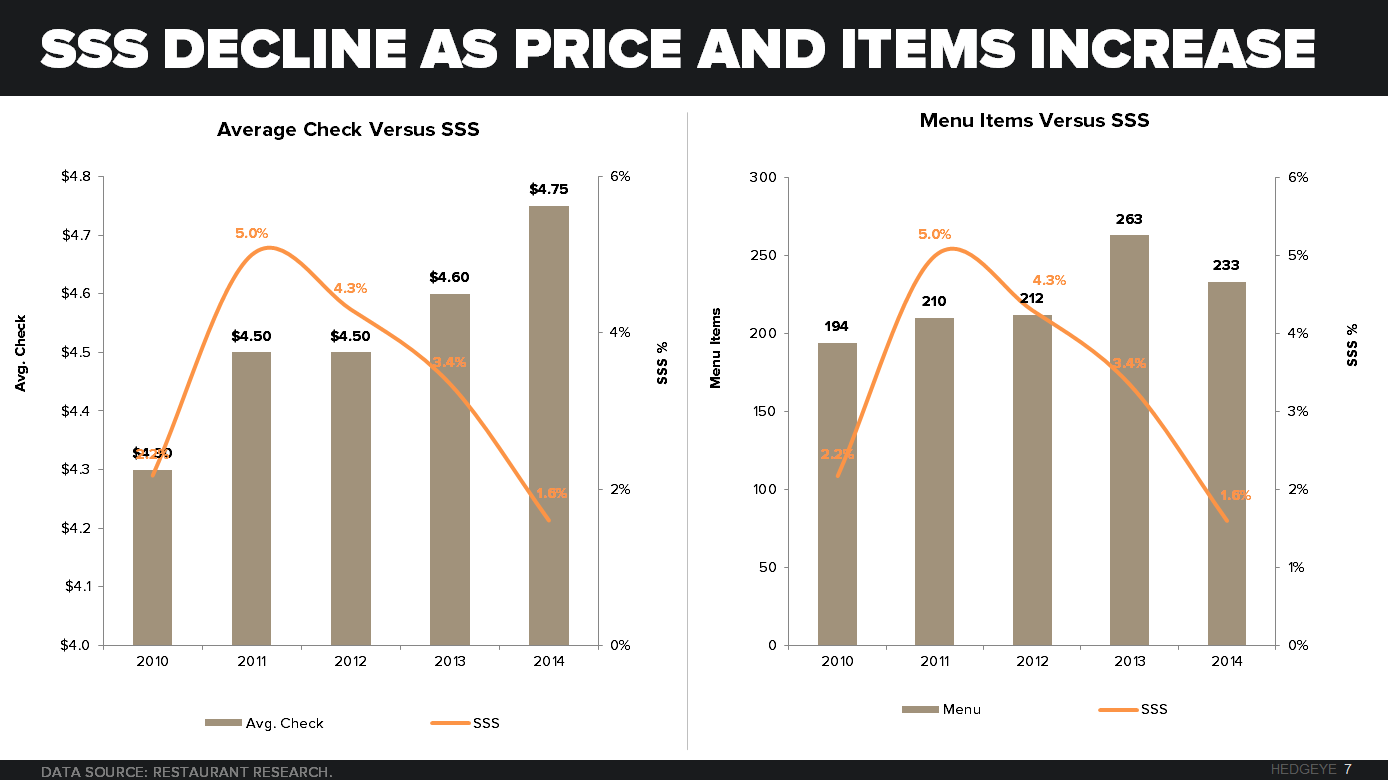
We would also note that DNKN reported traffic declines of 70bps last quarter. Over the last couple of years the company has increased menu complexity and used price aggressively to drive same-store sales. Both of those actions are separate issues that will need to be addressed if sales trends continue to decline.
We will continue to update you on the progress of our trackers on a regular basis.
Please call or e-mail with any questions.
Howard Penney
Managing Director
Shayne Laidlaw
Analyst