Weekly Activity Wrap Up
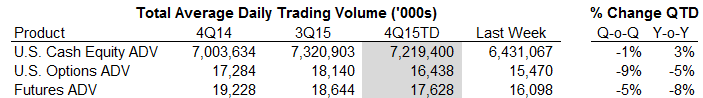
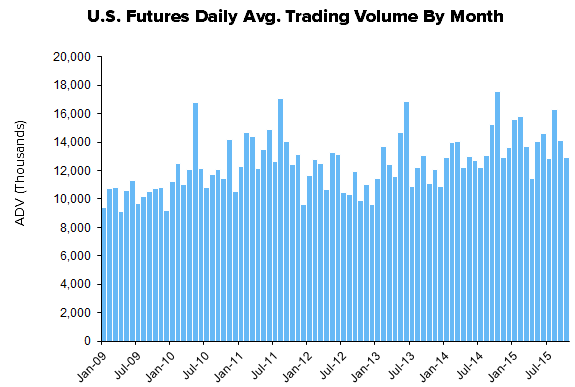
Volume across category contracted week-over-week starting its seasonal slough off into 4Q. U.S. cash equities' fourth-quarter ADV dropped to 7.2 billion from 7.9 billion the week prior but remains +3% higher year-over-year. Meanwhile, options and futures activity is negative Y/Y and Q/Q. U.S. equity options activity is averaging 16.4 million contracts per day in the new quarter, a -5% contraction versus the fourth quarter of 2014 and a -9% contraction versus 3Q15. Futures activity is averaging 17.6 million contracts per day in the fourth quarter, an -8% year-over-year contraction and -5% quarter-over-quarter decline.
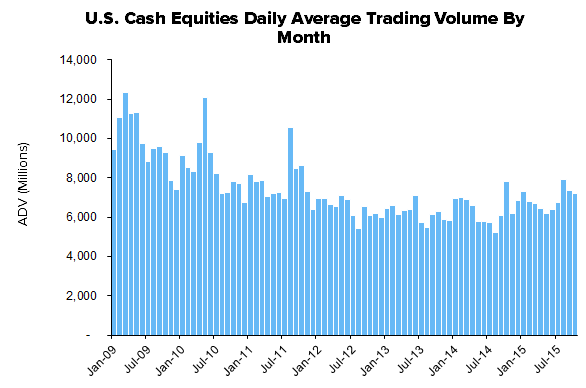
The slack in activity to start the new quarter is in line with seasonal patterns with both derivatives category (futures and options) historically putting in lower growth rates into 4Q. Cash equities tend to maintain a positive activity rate in the last quarter of the year, as the January effect and the tendenacy for stock prices to rise is priced in in December. All categories experience a substantial jump in 1Q activity, with new asset allocations being effected in the start of new calendar years:

U.S. Cash Equity Detail
U.S. cash equity trading came in at 6.4 billion shares traded per day this week. That brings the fourth quarter average to 7.2 billion shares traded per day, a +3% Y/Y expansion but -1% Q/Q contraction. The market share battle for volume is mixed. The New York Stock Exchange/ICE is taking a 25% share of fourth-quarter volume, a +4% year-over-year increase, while NASDAQ is taking an 18% share, a -9% year-over-year decline.


U.S. Options Detail
U.S. options activity came in at a 15.5 million ADV this week, bringing the 4Q15TD average to 16.4 million, a -5% Y/Y and -9% Q/Q contraction. The market share battle amongst venues continues to be one of losses at the NYSE/ICE, which has lost -12% of its share year-over-year settling at just 18% of options trading currently. Additionally, CBOE's market share has been falling recently and has started off the fourth quarter at 26%, -13% lower than 4Q14. NASDAQ, on the other hand, is starting the quarter strongly, increasing its market share by +15% compared to 3Q15, bringing itself back into line to the 24% share it held a year ago. BATS' share has been falling recently but at 8% in 4Q15TD it remains +32% higher than in 4Q14. Finally ISE/Deutsche's 15% share in 4Q15TD remains consistent with 3Q15, which brings it to +9% Y/Y growth.


U.S. Futures Detail
CME Group volume came in this week at 11.7 million contracts per day and is averaging 12.9 million for the fourth quarter, a -13% Y/Y and -10% Q/Q contraction. However, CME open interest, the most important beacon of forward activity, currently tallies 101.8 million CME contracts pending, good for +9% growth over the 93.7 million pending at the end of 4Q14, an expansion from the prior week's +6%.
Activity levels on the futures side at ICE fell to 4.4 million contracts this week. However, at 4.7 million contracts traded per day in 4Q15TD, activity has grown +7% Y/Y and +10% Q/Q. ICE open interest this week tallied 65.8 million contracts, a +11% expansion versus the 59.4 million contracts open at the end of 4Q14, an improvement from the prior week's +9%.


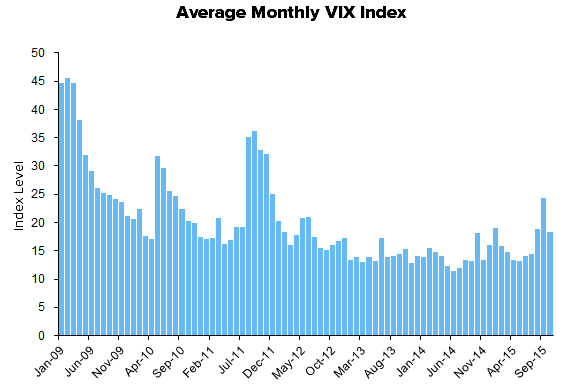
Monthly Historical View
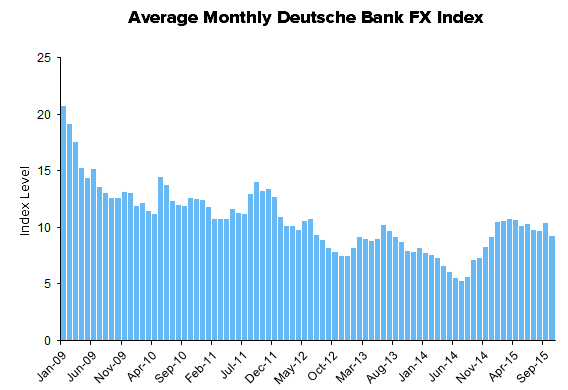
Monthly activity levels give a broader perspective of exchange based trends. As volatility levels, measured by the VIX, MOVE, and FX Vol should rise to normal levels after the drastic compression this cycle, we expect all marketplaces to experience higher activity levels.


Sector Revenue Exposure
The exchange sector has broadly diversified its revenue exposure over 10 years as public entities with varying top line sensitivity to the enclosed trading volume data. The table below highlights how trading volumes will flow through the various operating models at NASDAQ, CME Group, ICE, and Virtu:

Please let us know of any questions,
Jonathan Casteleyn, CFA, CMT
Joshua Steiner, CFA