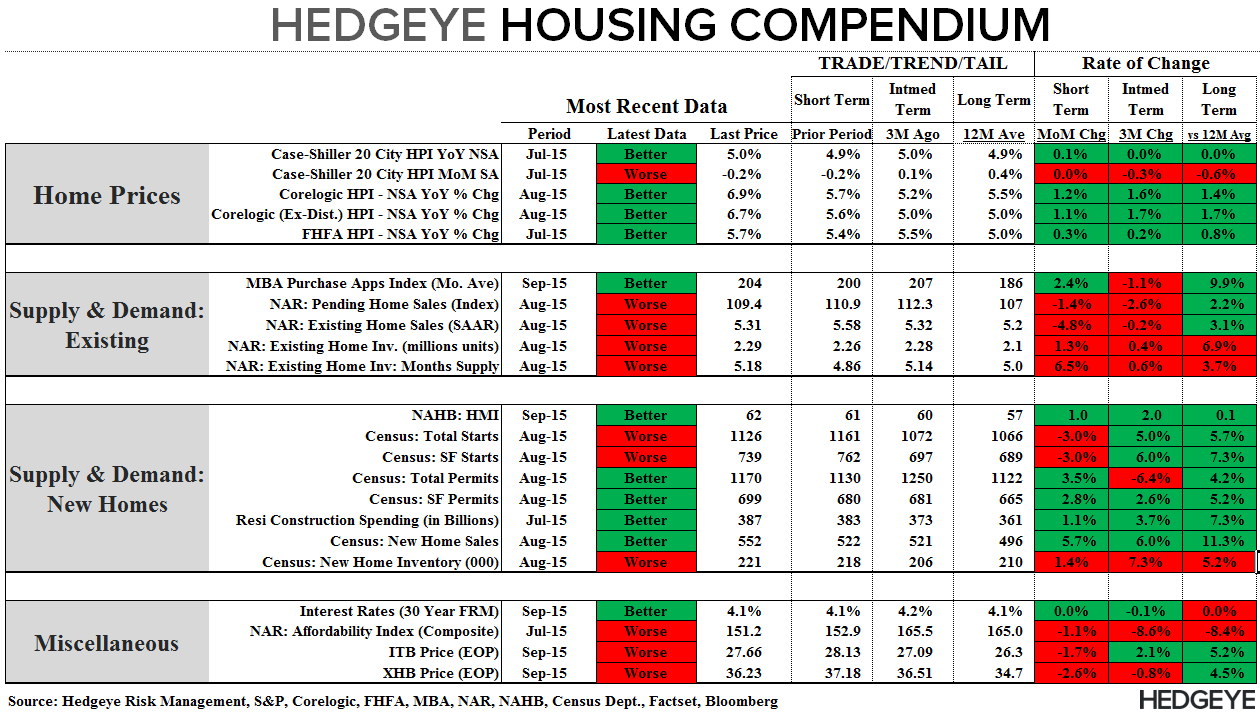
Our Hedgeye Housing Compendium table (below) aspires to present the state of the housing market in a visually-friendly format that takes about 30 seconds to consume.
Today's Focus: August CoreLogic Home Price Report
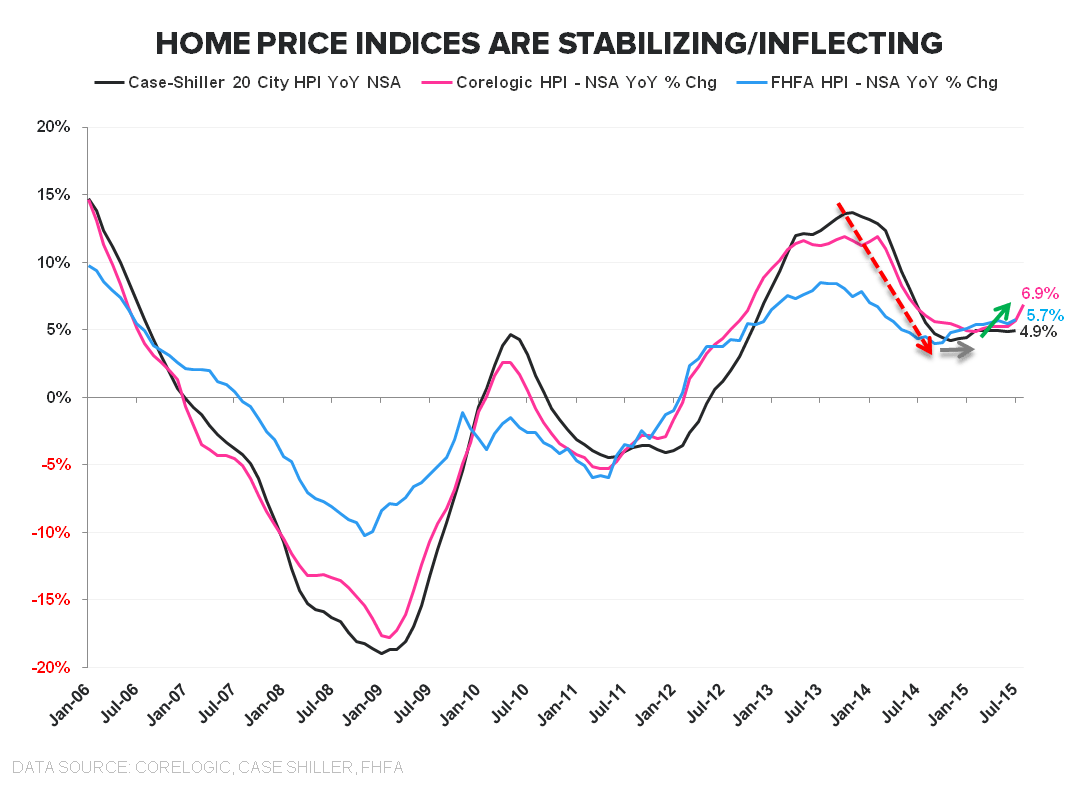
CoreLogic HPI: Home prices rose +1.2% month-over-month in August with year-over-year growth accelerating +120 bps sequentially to +6.9% - marking a 6th month of acceleration off the Feb ’15 RoC trough. The direction and magnitude of change was similar across the non-distressed series.
The implication of accelerating 2nd derivative price trends remains unchanged: Prices lag demand trends by ~12 months and trailing demand trends argue for further acceleration in HPI over the nearer-term. Rising price growth supports higher ASP’s, builder margin expansion, and (with housing related equities and home price growth showing a strong contemporaneous relationship) positive equity performance across the housing complex.


About CoreLogic:
CoreLogic HPI incorporates more than 30 years worth of repeat sales transactions, representing more than 55 million observations sourced from CoreLogic's property information database. The CoreLogic HPI provides a multi-tier market evaluation based on price, time between sales, property type, loan type (conforming vs. nonconforming), and distressed sales. The CoreLogic HPI is a repeat-sales index that tracks increases and decreases in sales prices for the same homes over time, which provides a more accurate constant-quality view of pricing trends than basing analysis on all home sales. The CoreLogic HPI covers 6,208 ZIP codes (58 percent of total U.S. population), 572 Core Based Statistical Areas (85 percent of total U.S. population) and 1,027 counties (82 percent of total U.S. population) located in all 50 states and the District of Columbia."
Joshua Steiner, CFA
Christian B. Drake