

Investment Company Institute Mutual Fund Data and ETF Money Flow:
In the 5-day period ending September 23rd, investors made net withdrawals from both total equity mutual funds and ETFs, which lost -$1.5 billion, and total bond mutual funds and ETFs, which lost -$778 million. Meanwhile, market participants shored up +$14 billion in money market funds during the week. This defensive reallocation came as the Fed's decision not to raise rates sparked fresh worries over the state of the economy and uncertainty about central bank policy going forward. One trend that has been consistent recently is this build of cash on the sidelines. Total money funds, according to ICI, has amassed a +$45 billion balance quarter-to-date after draw downs of -$18 billion in 2Q and -$92 billion in 1Q15. We continue to favor money fund manager Federated Investor (FII) as a Long position (see FII report) with emerging conservatism by investors and avoiding or Shorting the equity managers, Janus Capital and T. Rowe Price (See JNS and TROW reports).

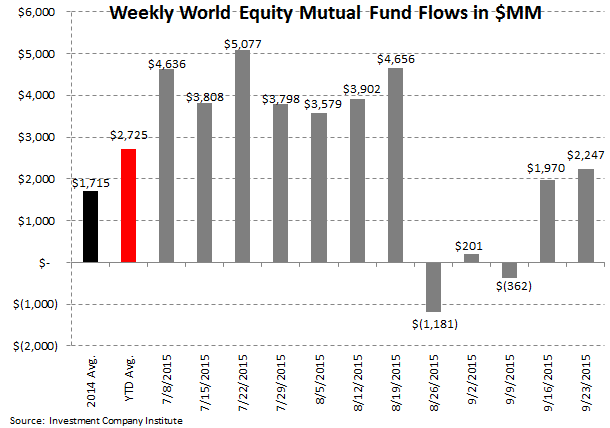
In the most recent 5-day period ending September 23rd, total equity mutual funds put up net inflows of +$2.3 billion, outpacing the year-to-date weekly average outflow of -$229 million and the 2014 average inflow of +$620 million. The inflow was composed of international stock fund contributions of +$2.2 billion and domestic stock fund contributions of +$87 million. International equity funds have had positive flows in 46 of the last 52 weeks while domestic equity funds have had only 11 weeks of positive flows over the same time period.
Fixed income mutual funds put up net outflows of -$1.8 billion, trailing the year-to-date weekly average inflow of +$354 million and the 2014 average inflow of +$926 million. The outflow was composed of tax-free or municipal bond funds contributions of +$628 million and taxable bond funds withdrawals of -$2.4 billion.
Equity ETFs had net redemptions of -$3.9 billion, trailing the year-to-date weekly average inflow of +$1.8 billion and the 2014 average inflow of +$3.2 billion. Fixed income ETFs had net inflows of +$973 million, trailing the year-to-date weekly average inflow of +$1.1 billion and the 2014 average inflow of +$1.0 billion.
Mutual fund flow data is collected weekly from the Investment Company Institute (ICI) and represents a survey of 95% of the investment management industry's mutual fund assets. Mutual fund data largely reflects the actions of retail investors. Exchange traded fund (ETF) information is extracted from Bloomberg and is matched to the same weekly reporting schedule as the ICI mutual fund data. According to industry leader Blackrock (BLK), U.S. ETF participation is 60% institutional investors and 40% retail investors.
Most Recent 12 Week Flow in Millions by Mutual Fund Product: Chart data is the most recent 12 weeks from the ICI mutual fund survey and includes the weekly average for 2014 and the weekly year-to-date average for 2015:


Cumulative Annual Flow in Millions by Mutual Fund Product: Chart data is the cumulative fund flow from the ICI mutual fund survey for each year starting with 2008.


Most Recent 12 Week Flow within Equity and Fixed Income Exchange Traded Funds: Chart data is the most recent 12 weeks from Bloomberg's ETF database (matched to the Wednesday to Wednesday reporting format of the ICI), the weekly average for 2014, and the weekly year-to-date average for 2015. In the third table are the results of the weekly flows into and out of the major market and sector SPDRs:


Sector and Asset Class Weekly ETF and Year-to-Date Results: In sector SPDR callouts, investors pulled -$7.5 billion or -4% from the broad-market SPY last week as the Fed's decision not to raise rates sparked fresh fears over the state of the economy. Meanwhile, investors sought the safety of treasury bonds, contributing +5% or +$303 million to the long treasury TLT ETF.

Cumulative Annual Flow in Millions within Equity and Fixed Income Exchange Traded Funds: Chart data is the cumulative fund flow from Bloomberg's ETF database for each year starting with 2013.


Net Results:
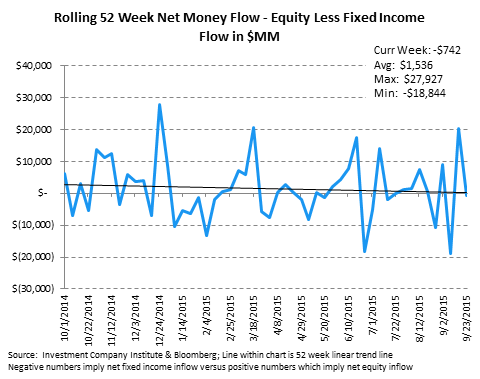
The net of total equity mutual fund and ETF flows against total bond mutual fund and ETF flows totaled a negative -$742 million spread for the week (-$1.5 billion of total equity outflow net of the -$778 million outflow from fixed income; positive numbers imply greater money flow to stocks; negative numbers imply greater money flow to bonds). The 52-week moving average is +$1.5 billion (more positive money flow to equities) with a 52-week high of +$27.9 billion (more positive money flow to equities) and a 52-week low of -$18.8 billion (negative numbers imply more positive money flow to bonds for the week.)
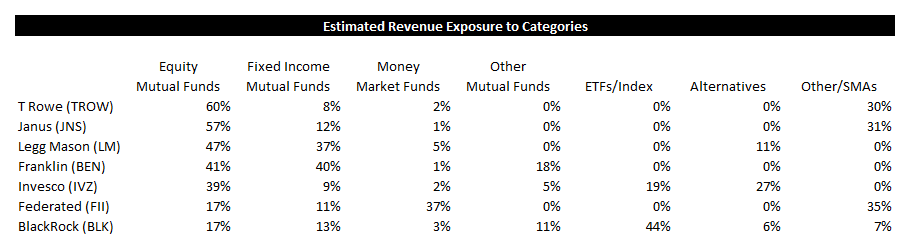
Exposures: The weekly data herein is important for the public asset managers with trends in mutual funds and ETFs impacting the companies with the following estimated revenue impact:
Jonathan Casteleyn, CFA, CMT
Joshua Steiner, CFA
