

Key Takeaway:
Even with the third reading on second quarter U.S. GDP coming in at 3.9%, higher than the 3.7% expected, domestic CDS spreads widened. Moreover, CDS spreads widened globally, especially in emerging markets, on further evidence of slowing growth in the Chinese economy, which has become the number one global risk factor for investors; a preliminary reading on Chinese manufacturing activity showed factory output at its lowest level since the financial crisis. Finally, the high yield YTM in the U.S. continues to rise, increasing by 35 bps last week.
Our heatmap below is showing mostly red warning signals on the short, intermediate, and long term.
Current Ideas:

Financial Risk Monitor Summary
• Short-term(WoW): Negative / 1 of 12 improved / 5 out of 12 worsened / 6 of 12 unchanged
• Intermediate-term(WoW): Negative / 0 of 12 improved / 8 out of 12 worsened / 4 of 12 unchanged
• Long-term(WoW): Negative / 1 of 12 improved / 2 out of 12 worsened / 9 of 12 unchanged

1. U.S. Financial CDS – Swaps widened for 23 out of 27 domestic financial institutions. Even with positive economic data showing that 2Q15 GDP grew at a higher than expected 3.9%, perceived default risk for financial institutions rose; CDS spreads widened by 5 bps at the median.
Widened the least/ tightened the most WoW: CB, SLM, SLM
Widened the most WoW: GNW, TRV, BAC
Tightened the most WoW: CB, AGO, MBI
Widened the most MoM: GNW, MMC, MET

2. European Financial CDS – Swaps mostly widened in Europe last week. The median change was a 7 bps widening as investors focused on the risk from China.

3. Asian Financial CDS – In Asia, a preliminary reading on Chinese manufacturing activity showed factory output at its lowest level since the financial crisis, causing swaps for Chinese banks to widen between 16 and 17 bps. Additionally, Indian banks' CDS widened between 12 bps and 17 bps.

4. Sovereign CDS – Sovereign Swaps mostly widened over last week. Italian, Spanish, and Portuguese swaps widened the most, by 12, 12, and 19 bps respectively.


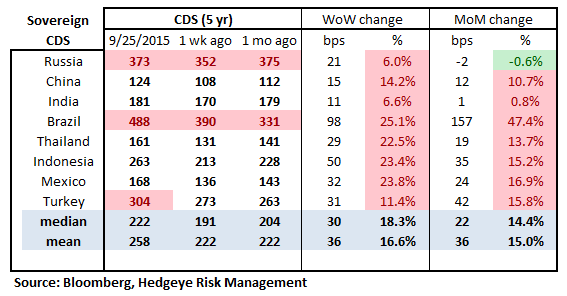
5. Emerging Market Sovereign CDS – Emerging market swaps widened last week, largely on worries of effects from slowing Chinese growth and a future interest rate hike by the U.S. Federal Reserve. Brazilian sovereign swaps blew out by 98 bps to 488 as data showed rising unemployment in the country and the country's central bank forecast a deeper recession.

6. High Yield (YTM) Monitor – High Yield rates rose 35 bps last week, ending the week at 7.65% versus 7.30% the prior week.

7. Leveraged Loan Index Monitor – The Leveraged Loan Index fell 10.0 points last week, ending at 1857.

8. TED Spread Monitor – The TED spread rose 1 basis point last week, ending the week at 34 bps this week versus last week’s print of 33 bps.

9. CRB Commodity Price Index – The CRB index fell -1.6%, ending the week at 196 versus 199 the prior week. As compared with the prior month, commodity prices have decreased -0.7%. We generally regard changes in commodity prices on the margin as having meaningful consumption implications.

10. Euribor-OIS Spread – The Euribor-OIS spread (the difference between the euro interbank lending rate and overnight indexed swaps) measures bank counterparty risk in the Eurozone. The OIS is analogous to the effective Fed Funds rate in the United States. Banks lending at the OIS do not swap principal, so counterparty risk in the OIS is minimal. By contrast, the Euribor rate is the rate offered for unsecured interbank lending. Thus, the spread between the two isolates counterparty risk. The Euribor-OIS spread was unchanged at 11 bps.

11. Chinese Interbank Rate (Shifon Index) – The Shifon Index rose 1 basis point last week, ending the week at 1.91% versus last week’s print of 1.90%. The Shifon Index measures banks’ overnight lending rates to one another, a gauge of systemic stress in the Chinese banking system.

12. Chinese Steel – Steel prices in China fell 0.5% last week, or 10 yuan/ton, to 2197 yuan/ton. We use Chinese steel rebar prices to gauge Chinese construction activity and, by extension, the health of the Chinese economy.

13. 2-10 Spread – Last week the 2-10 spread widened to 147 bps, 2 bps wider than a week ago. We track the 2-10 spread as an indicator of bank margin pressure.

14. XLF Macro Quantitative Setup – Our Macro team’s quantitative setup in the XLF shows 2.7% upside to TRADE resistance and 2.8% downside to TRADE support.

Joshua Steiner, CFA
Jonathan Casteleyn, CFA, CMT
