

Investment Company Institute Mutual Fund Data and ETF Money Flow:
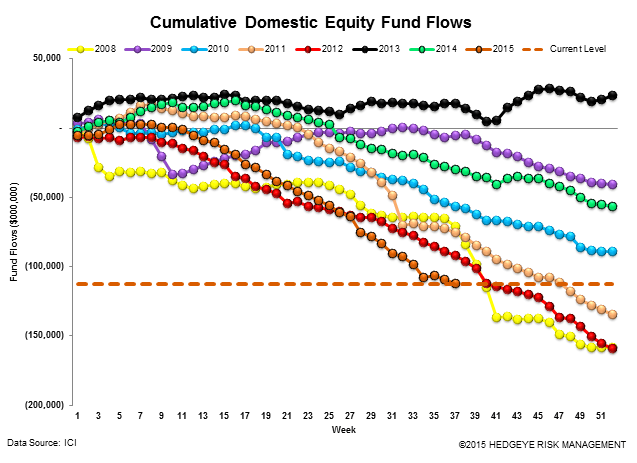
In the five-day period ending September 16th, investors reduced interest rate exposure withdrawing -$2.2 billion from total bond mutual funds and ETFs. Alternatively, the investment community made a aggressive net contribution of +$18.1 billion to total equity products, the largest inflow to the stock asset class so far in the third quarter. Investors however opted for less active risk with +$19.3 billion of the allocation comprised of passive ETF inflows, +$11.2 billion of which went to the broad-market SPY ETF. Net equity mutual fund flows were negative on the week with international equity putting up +$2.0 billion of subscriptions offset by domestic equity funds which lost another -$3.1 billion. The cumulative running loss for domestic stock funds year-to-date is now -$112.3 billion.
We continue to recommend Shorting/Avoiding Janus Capital (JNS) and T. Rowe Price (TROW) on these trends. At Janus, what was once resurgent fund raising with emerging credit and a slight improvement in some of their equity funds has again turned to substantial outflow this summer. In our note, The More Things Change... The More They Stay the Same, we detail the firm's fund flow woes, most recently evident in the -$900 million firm-wide net redemption in August, the worst monthly period in 22 months. Additionally, we emphasize that both JNS and TROW across cycle have been 100% reliant on market returns to grow AUM and earnings. This situation exacerbates if volatility and negative beta returns persists past 3Q/4Q 2015.

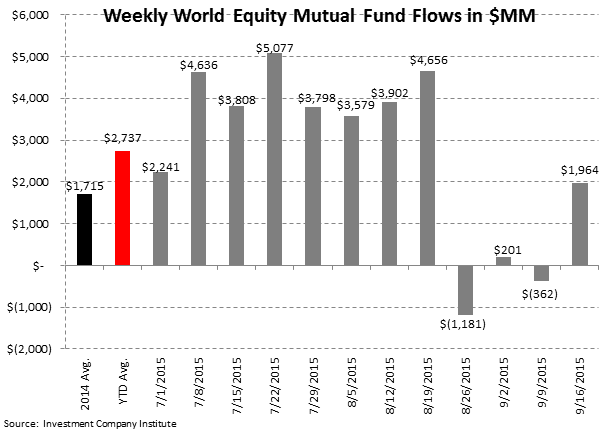
In the most recent 5-day period ending September 16th, total equity mutual funds put up net outflows of -$1.1 billion, trailing the year-to-date weekly average outflow of -$299 million and the 2014 average inflow of +$620 million. The outflow was composed of international stock fund contributions of +$2.0 billion and domestic stock fund withdrawals of -$3.1 billion. International equity funds have had positive flows in 46 of the last 52 weeks while domestic equity funds have had only 10 weeks of positive flows over the same time period.
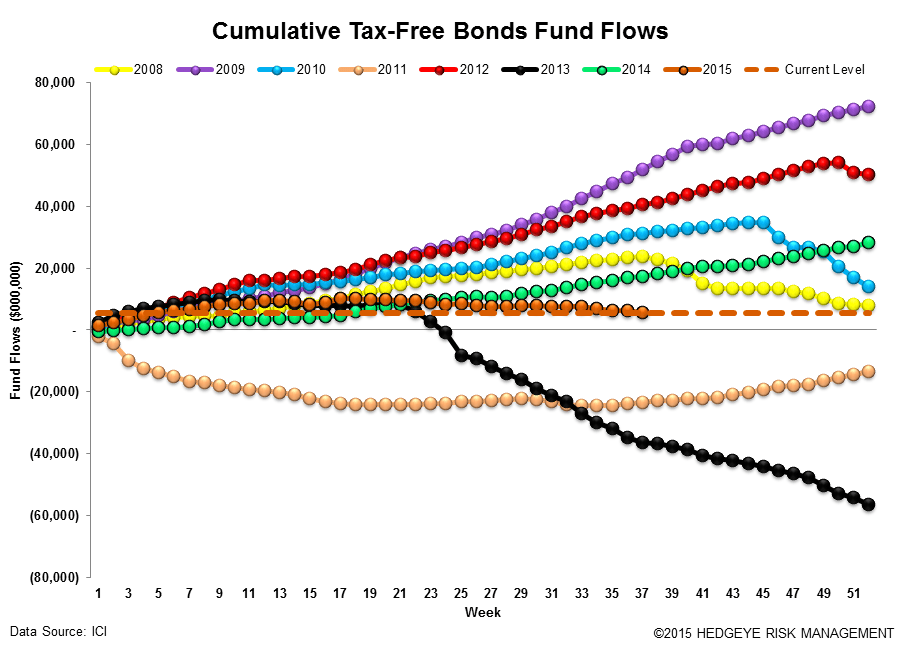
Fixed income mutual funds put up net outflows of -$4.5 billion, trailing the year-to-date weekly average inflow of +$410 million and the 2014 average inflow of +$926 million. The outflow was composed of tax-free or municipal bond funds withdrawals of -$589 million and taxable bond funds withdrawals of -$3.9 billion.
Equity ETFs had net subscriptions of +$19.3 billion, outpacing the year-to-date weekly average inflow of +$2.0 billion and the 2014 average inflow of +$3.2 billion. Fixed income ETFs had net inflows of +$2.3 billion, outpacing the year-to-date weekly average inflow of +$1.1 billion and the 2014 average inflow of +$1.0 billion.
Mutual fund flow data is collected weekly from the Investment Company Institute (ICI) and represents a survey of 95% of the investment management industry's mutual fund assets. Mutual fund data largely reflects the actions of retail investors. Exchange traded fund (ETF) information is extracted from Bloomberg and is matched to the same weekly reporting schedule as the ICI mutual fund data. According to industry leader Blackrock (BLK), U.S. ETF participation is 60% institutional investors and 40% retail investors.
Most Recent 12 Week Flow in Millions by Mutual Fund Product: Chart data is the most recent 12 weeks from the ICI mutual fund survey and includes the weekly average for 2014 and the weekly year-to-date average for 2015:


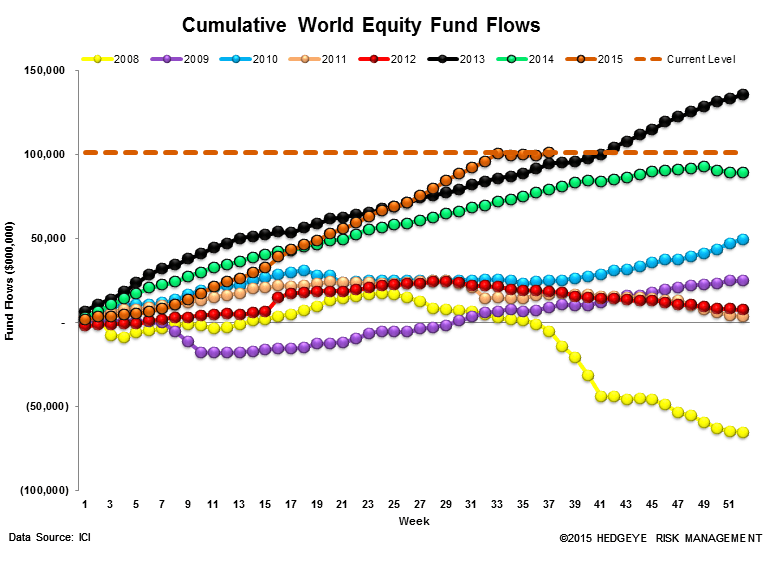
Cumulative Annual Flow in Millions by Mutual Fund Product: Chart data is the cumulative fund flow from the ICI mutual fund survey for each year starting with 2008.


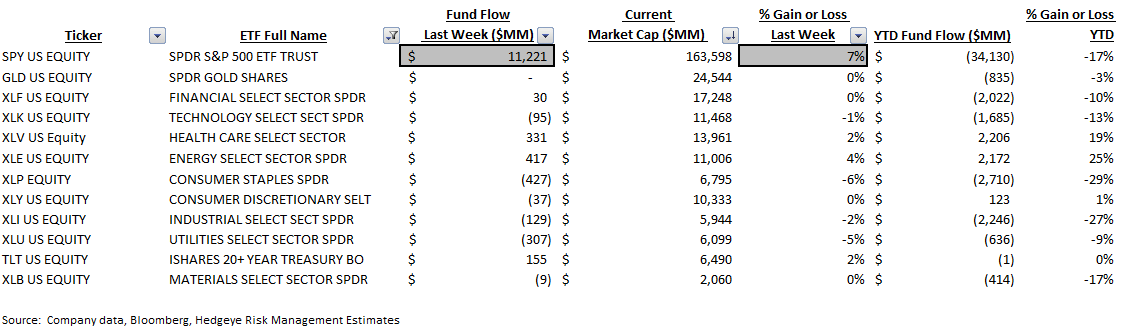
Most Recent 12 Week Flow within Equity and Fixed Income Exchange Traded Funds: Chart data is the most recent 12 weeks from Bloomberg's ETF database (matched to the Wednesday to Wednesday reporting format of the ICI), the weekly average for 2014, and the weekly year-to-date average for 2015. In the third table are the results of the weekly flows into and out of the major market and sector SPDRs:


Sector and Asset Class Weekly ETF and Year-to-Date Results: In sector SPDR callouts, investors contributed +$11.2 billion or +7% to the SPY last week, favoring broad-market equity exposure over any individual sector.
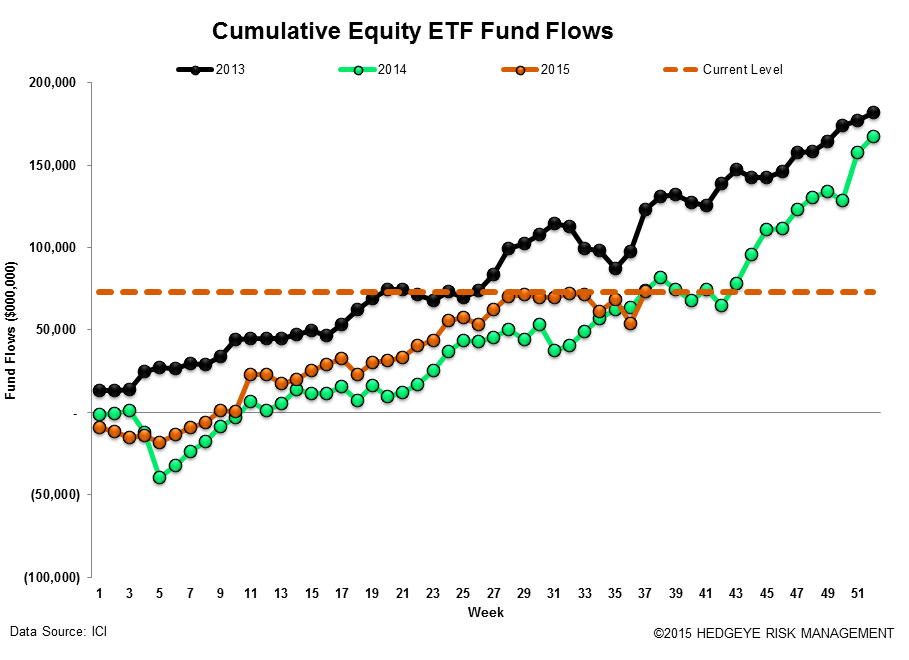
Cumulative Annual Flow in Millions within Equity and Fixed Income Exchange Traded Funds: Chart data is the cumulative fund flow from Bloomberg's ETF database for each year starting with 2013.

Net Results:
The net of total equity mutual fund and ETF flows against total bond mutual fund and ETF flows totaled a positive +$20.3 billion spread for the week (+$18.1 billion of total equity inflow net of the -$2.2 billion outflow from fixed income; positive numbers imply greater money flow to stocks; negative numbers imply greater money flow to bonds). The 52-week moving average is +$1.7 billion (more positive money flow to equities) with a 52-week high of +$27.9 billion (more positive money flow to equities) and a 52-week low of -$18.8 billion (negative numbers imply more positive money flow to bonds for the week.)

Exposures: The weekly data herein is important for the public asset managers with trends in mutual funds and ETFs impacting the companies with the following estimated revenue impact:

Jonathan Casteleyn, CFA, CMT
Joshua Steiner, CFA
