

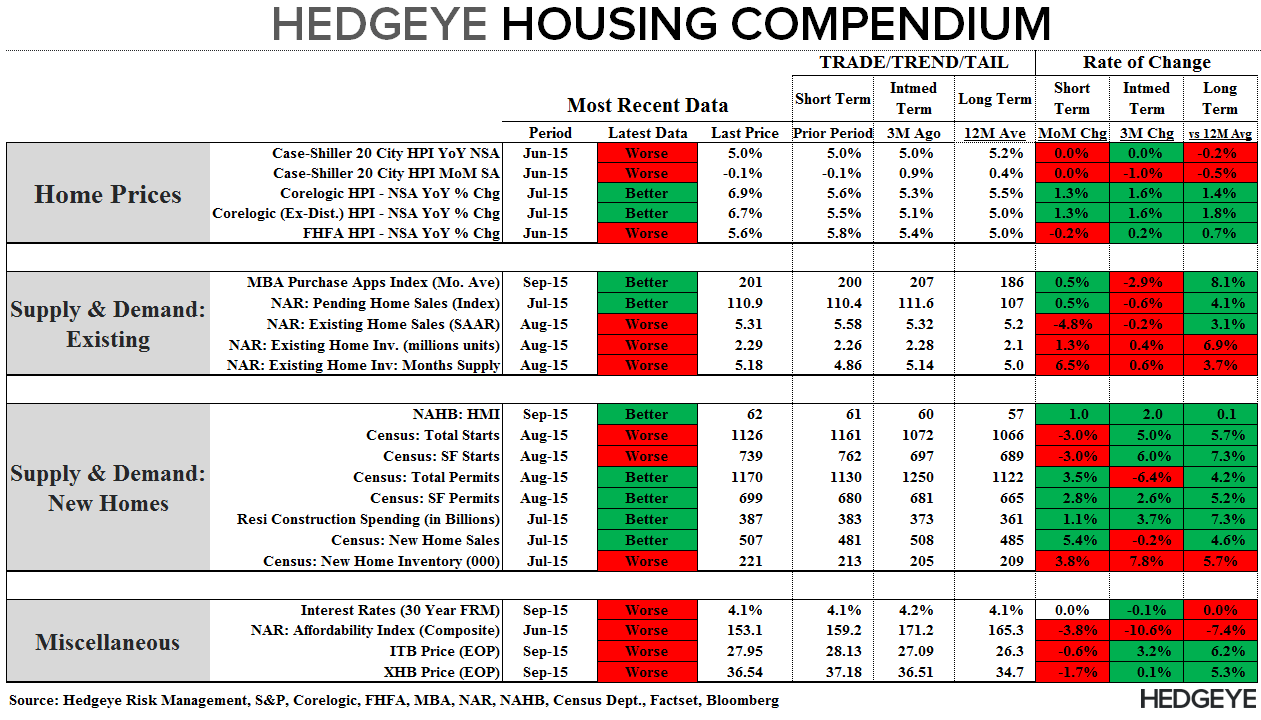
Our Hedgeye Housing Compendium table (below) aspires to present the state of the housing market in a visually-friendly format that takes about 30 seconds to consume.
Today's Focus: August Existing Home Sales
EHS | AS EXPECTED: EHS declined -4.8% sequentially in August, the first decline in four months and largest since January. While the magnitude of decline was a bit steep (the month-to-month numbers are noisy) the decline was not unexpected. Relative softness in PHS in both June and July along with flat-to-down trends in Purchase Applications have signaled a soft existing number for over a month. Interestingly, unless we get a sizeable negative revision or notable decline in Pending Sales for August (data due out next Monday, 9/28), the setup for EHS reverses with the risk shifting to the upside for Sept/Oct (see 1st chart below).
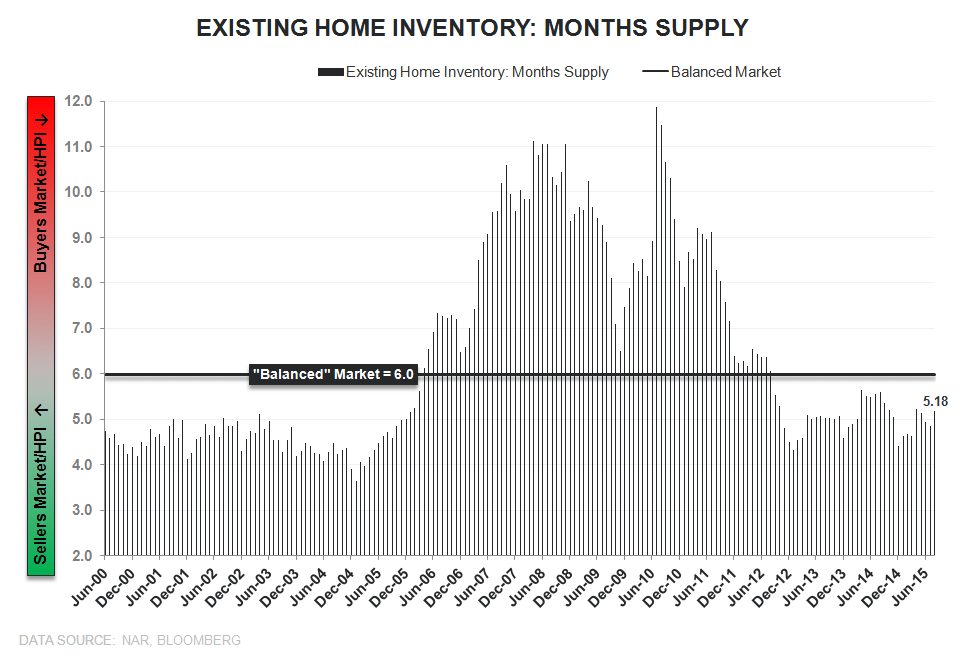
Inventory & Price: Units of inventory rose +1.3% MoM in August to 2.29 mm and with sales declining, inventory on a month-supply basis rose to 5.18 months – representing the 1st month in three above 5-mo but holding below the traditional balanced market level of 6-mo for a 36th consecutive month. Ongoing supply tightness in the 90% of the market that is EHS remains supportive of improving HPI trends and the acceleration in price growth observed across the CoreLogic and FHFA price series in recent months. Again, improving 2nd derivative trends in HPI augurs positively for housing related equities given the strong contemporaneous relationship between the two.
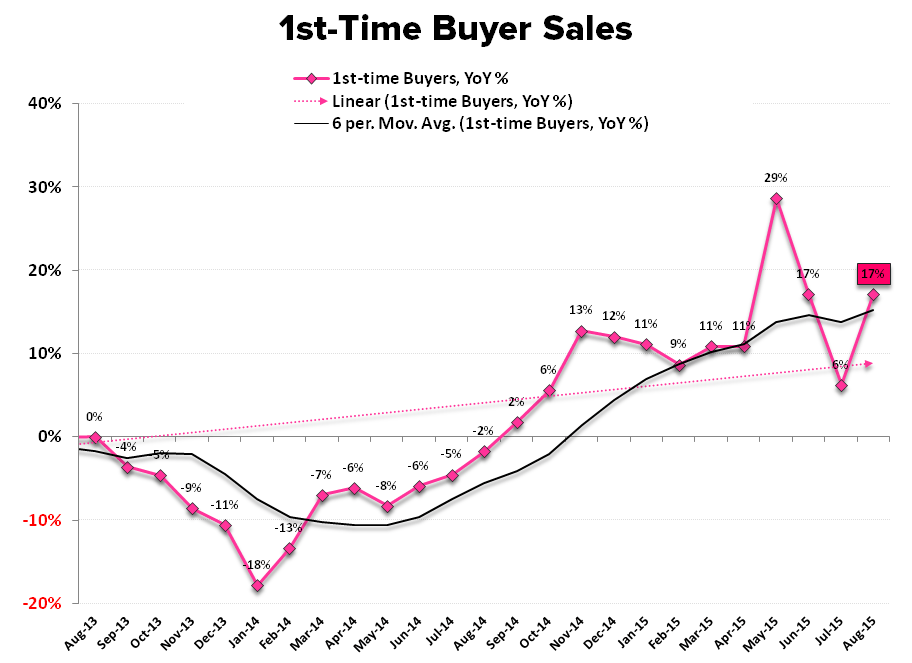
1st-time buyers: First-time buyers rose to 32% of the market in August, up from 28% in July and equal to the 3-year highs recorded May. The share gain in August was a function of a decline in both cash and investor sales, a modest retreat in non-1st time conventional buyers and accelerating demand within the cohort itself. Sales to 1st-time buyers rose +8.8% MoM and accelerated to +17.2% YoY (vs +6.3% prior). So long as the labor/income fundamentals continue to improve across the 20-35YOA demographic, rising headship rates and single-family purchase demand should manifest on a moderate lag. Mean reversion back to 40% market share remains the primary catalyst for taking EHS back over the 6.0 mm mark.
Supply Redux: A Delicate Balance
Because closed sales activity is well-telegraphed by prior month PHS, the inventory data sit as the primary figures of import in the EHS release and the lone (official) real-time read on the supply side of the existing market.
Supply, Demand, and Price remain in a delicate three way dance towards normalization and, from an inventory-centric perspective, there are a number of leading factors posited as underpinning the supply stagnation in housing.
Each are valid to some greater or lesser extent and their collective influence will continue to anchor the inventory environment in the existing market over the medium-term. We summarily review each, in turn, below.
- Low Rates: Low rates locked in during the post-crisis period remain a disincentive to selling/moving and an inertial headwind to rising inventory.
- Demographics: Top heavy demographics with Boomers (which are a significant % of the homeownership base) entering the peri-retirement period will weigh on housing turnover broadly. Aging in place remains an emergent trend and moving-out will not become an outsized driver of supply for another decade when the Boomer bulge starts moving beyond 80 YOA.
- Equity: If Boomers are dragging on inventory and Millennial demand is just beginning to percolate, what’s left? Mostly Gen X’ers. Those aged ~35-50 represent a significant source of potential supply in the form of trade-up buying. A meaningful percentage in this group, however, remain in negative or near-negative equity positions, serving as weight to both entry level supply and mid/upper market demand.
Rising prices are likely to spur supply as negative and near-negative equity positions turn increasingly positive and capacity for trade-up purchases improves. Rising prices, however, can constrain affordability for new buyers and for 1st time buyers specifically – with the latter representing the lower rung in housing’s ladder and the primary liquidity source for trade-up buyers.
The dynamics underpinning the supply environment are many-fold with the path to market balance a delicate one to tread. Realistically, the least disruptive path to balance on the supply side – without a cratering in demand – probably, and simply, remains time. Measured HPI alongside ongoing recovery in household incomes would provide for further emergence of 1st-time buyer demand in conjunction with crawling improvement in housing equity positions for prime trade-up buyers.


About Existing Home Sales:
The National Association of Realtors’ Existing Home Sales index measures the number of closed resales of homes, townhomes, condominiums, and co-ops. Existing home sales do not take into account the sale of newly constructed homes. Existing home sales account for 85-95% of all home sales (new home sales account for the remainder). Therefore, increases in existing home sales tend to signify increasing consumer confidence in the market. Additionally, Existing Home Sales is a lagging series, as it measures the closing of homes that were pending home sales between 1 and 2 months earlier.
Frequency:
The NAR’s Existing Home Sales index is published between the 20th and the 22nd of each month. The index covers data from the prior month.
Joshua Steiner, CFA
Christian B. Drake
