Editor's Note: The chart and brief excerpt below are from today's Early Look written by Hedgeye CEO Keith McCullough. Click here if you're tired of lousy, consensus research and want to stay a step or two ahead of the macro herd.
...That’s why, from a Style Factoring perspective, if all you’ve done in the last 3 months is downshift your portfolio’s Equity Beta (i.e. sell your cyclical and chart chasing betas), you’ve beaten most of your competition.
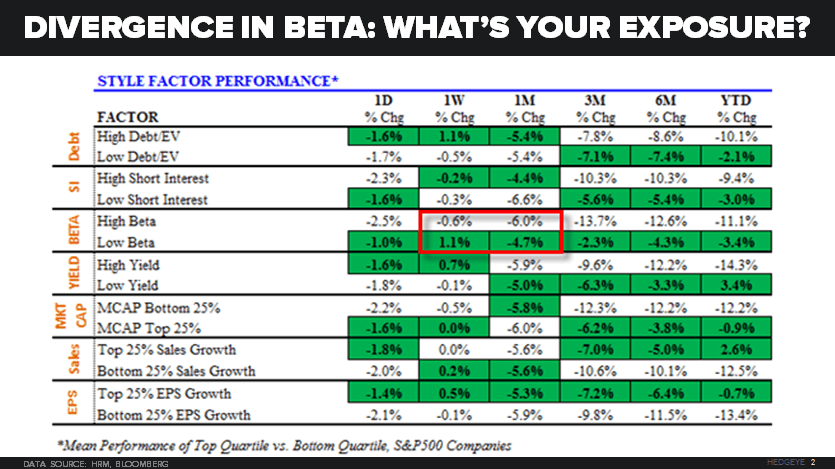
Here’s how “Low-Beta” (mean performance of the Top Quartile in the SP500 vs. the Bottom Quartile) has performed:
- One-week duration = +1.1% (vs. High Beta -0.6%)
- One-month duration = -4.7% (vs. High Beta -6.0%)
- Three-month duration = -2.3% (vs. High Beta -13.7%)