Our Hedgeye Housing Compendium table (below) aspires to present the state of the housing market in a visually-friendly format that takes about 30 seconds to consume.

Today's Focus: September NAHB HMI (Builder Confidence Survey) & Mortgage Apps
Builder Confidence: New Highs | Builder Confidence made another post-crisis high in September with the HMI rising +1pt to 62, marking the strongest reading since October 2005.
Across the Sub-indices, 6M Expectations dipped -2 pts sequentially while Current Sales and Current Traffic both rose +2pts. Geographically, builder optimism in the West was flat MoM while the South, Midwest and Northeast all recorded gains sequentially.
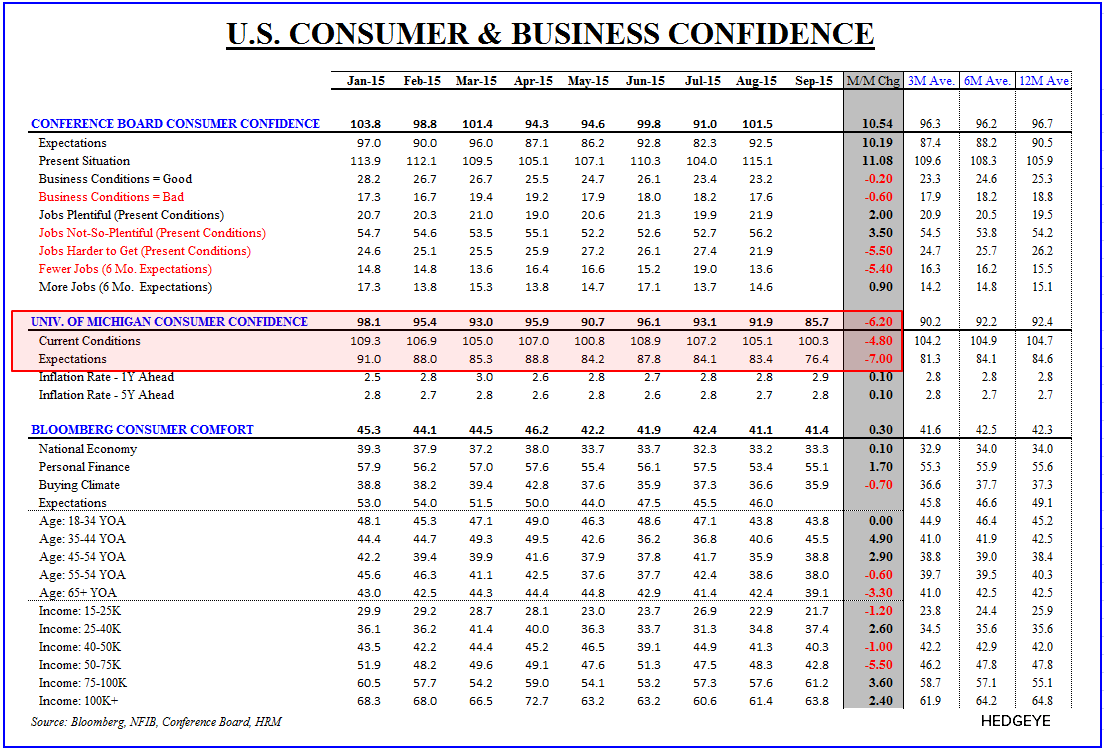
Builder vs Consumer Confidence: Given the low base of new construction activity, continued low rates, ongoing labor market improvement and the steady gains observed across Pending, Existing and New Homes sales YTD, the sustained build of positive sentiment is not particularly surprising. Under the hood, the decline in 6M Expectations in September accords with the steep drop observed across the same category in the University of Michigan’s preliminary September reading (see confidence table below) although the headline HMI doesn’t appear to be impacted by the global turmoil and equity market correction that seemingly weighed on the broader measure of consumer confidence.
The divergence is interesting given the tendency for builder confidence to lead both Consumer Confidence and broader macro inflections over recent cycles. Any emergent bifurcation between the two confidence measures could also be reflecting the divergent short-to-medium term paths being tread by housing and the larger economic cycle. As we’ve highlighted (see: Resi Construction & the Cycle), while we’re late or mid-late cycle more broadly, we’re probably somewhere closer to early-mid or mid cycle in housing itself given the significantly lagged recovery in the sector.
With respect to NAHB commentary around the September data:
NAHB Chairman Tom Woods commented:
"The HMI shows that single-family housing is making solid progress ….However, our members continue to tell us that they are concerned about the availability of lots and labor.”
NAHB Chief Economist David Crowe added:
"NAHB is projecting about 1.1 million total housing starts this year ..Today's report is consistent with our forecast, and barring any unexpected jolts, we expect housing to keep moving forward at a steady, modest rate through the end of the year.”
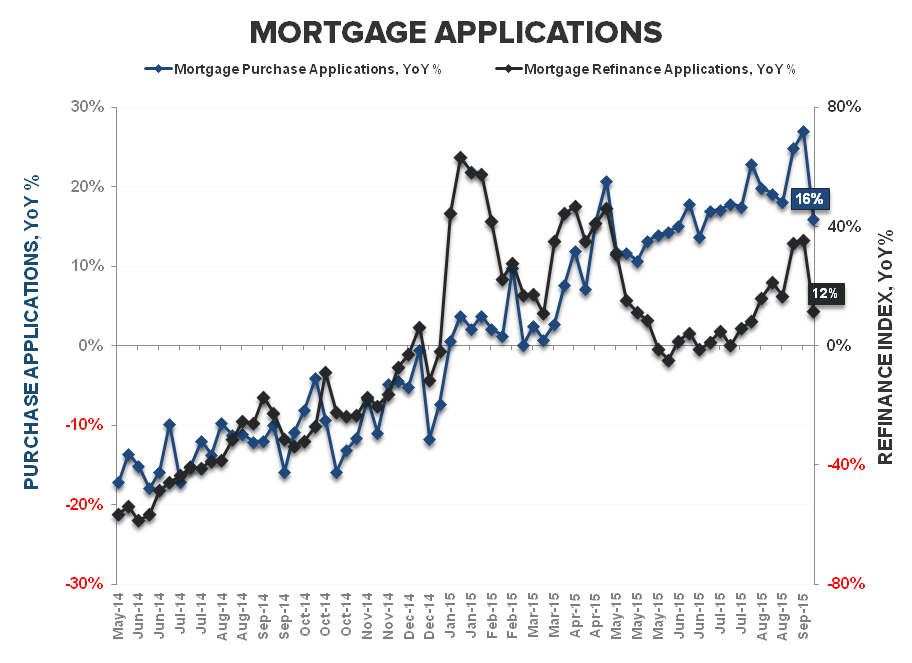
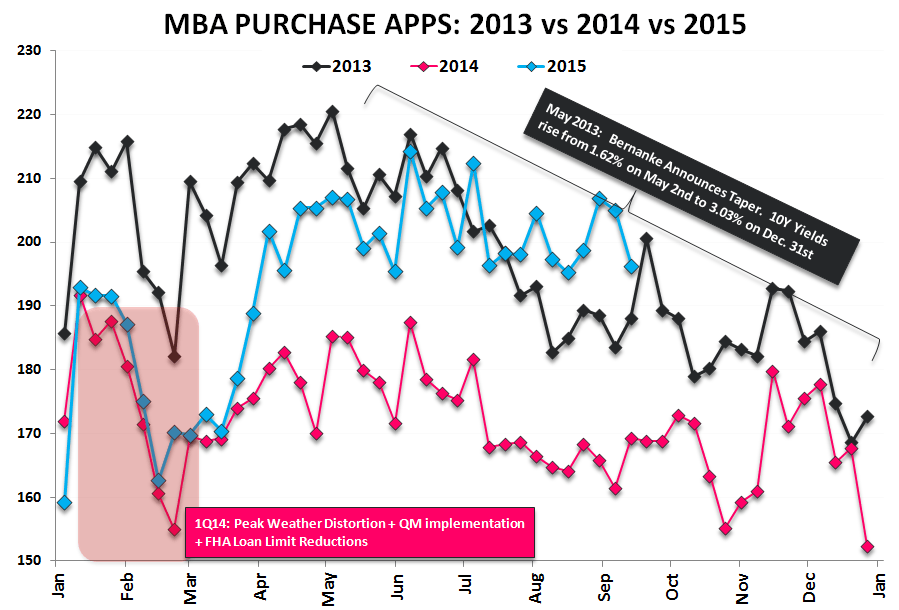
Purchase Applications: Mostly Noise | Purchase application demand fell -4.2% in the latest week while decelerating to +15.9% YoY. Given that it was a holiday shortened week and the holiday was shifted relative to last year, the noise level in this week’s data is substantial. The prevailing read-though on the trend in the data remains largely unchanged, however. Purchase demand remains lower by ~1% QoQ in 3Q while reported year-over-year growth remains (& should remain) solid as compares remain easy through the balance of 2H.
Monetary policy and the flow through impact to rates will likely remain the largest externality for housing in the nearer-term. Beyond any nearer-term volatility associated with the attempt at policy normalization, our macro call on both growth and inflation remains slower-and-lower-for-longer and would view a flattening of the curve and flat-to-lower long-term rates as an increasingly likely by-product of a sustained attempt at tightening.
(h/t to Brian Collins for today's note title inspiration)


About the NAHB HMI:
The Housing Market Index (HMI) is based on a monthly survey of NAHB members designed to take the pulse of the single-family housing market. The monthly survey has been conducted for 30 years. The survey asks respondents to rate market conditions for the sale of new homes at the present time and in the next 6 months as well as the traffic of prospective buyers of new homes. The HMI is a weighted average of separate diffusion indices for these three key single-family series. The HMI can range from 0 to 100, where a value over 50 implies conditions are, on average, improving, a value below 50 implies conditions are worsening, and an index value of 50 indicates that the housing market is neither improving nor worsening.
About MBA Mortgage Applications:
The Mortgage Bankers’ Association’s mortgage applications index covers more than 75% of mortgage applications originated through retail and consumer direct channels. It does not include loans delivered through wholesale broker and correspondent channels. The MBA mortgage purchase applications index is considered a leading indicator of single-family home sales and construction. Moreover, it is the only housing index that is released on a weekly basis.
Frequency:
The MBA Purchase Apps index is released every Wednesday morning at 7 am EST.
Joshua Steiner, CFA
Christian B. Drake