Editor's Note: The chart and excerpt below are from today's Early Look written by Hedgeye CEO Keith McCullough. Click here for more information on how you can subscribe and upgrade your market and economic game.
...[Y]ou’ll recall that a #StrongDollar is the only long-term pattern of purchasing power strength that Americans have enjoyed. In fact, a #StrongDollar was coincident with two of the most popular Presidents in US history:
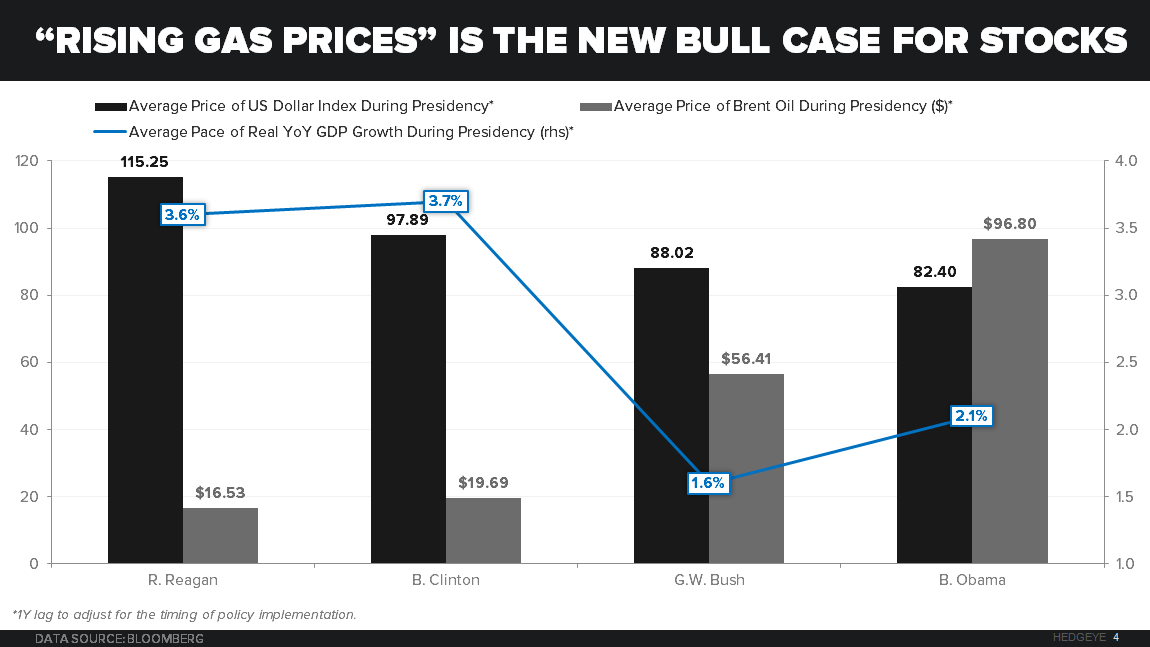
- 1983-1989 (Reagan) had the strongest of #StrongDollars (see Chart of The Day), sub $20/oil and ~4% real GDP
- 1993-1999 (Clinton) had the 2nd strongest USD period and average < $20 Oil with ~4% GDP too
So, maybe… just maybe – everyone is staring at the tree ahead of this week’s Federal Reserve decision (Thursday) instead of the forest.