

Weekly Activity Wrap Up
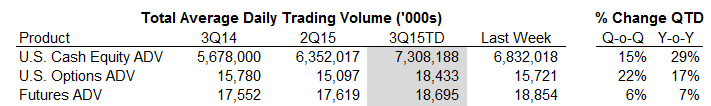
The Labor Day holiday couldn't pause futures activity (the combination of CME Group and ICE Futures U.S. activity) which came in strongly this week at an average 18.9 million contracts per day, exceeding the third-quarter-to-date average of 18.7 million. That brings the third quarter to a +7% year-over-year and +6% quarter-over-quarter expansion. Our Best Idea in the sector continues to be the CME Group (CME). As the chart below shows, volatility tends to be seasonally high as we move into the "back to work" months of September and October and CME Group exchange volumes have already begun to benefit from this trend. See our recent note on the company which highlights the back-end-loaded nature of the stock's returns given historical Fall volatility and a year-end special dividend.

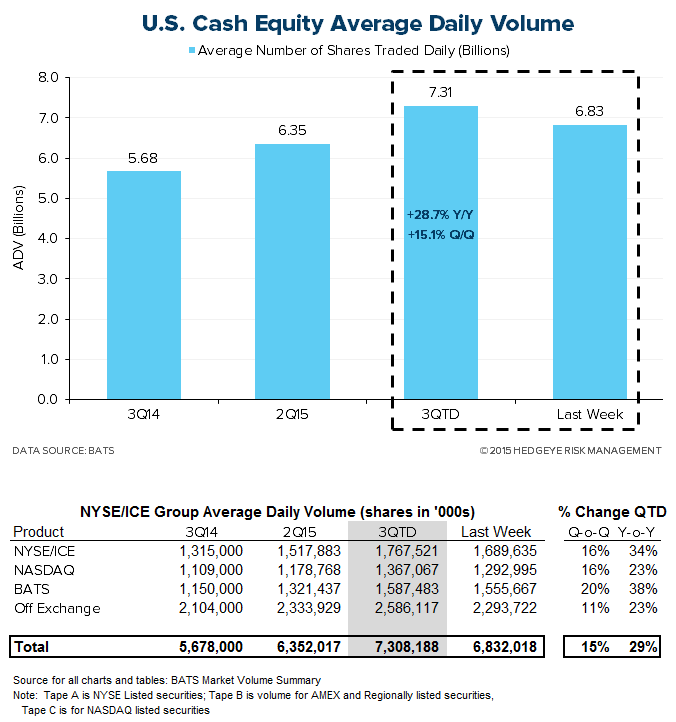
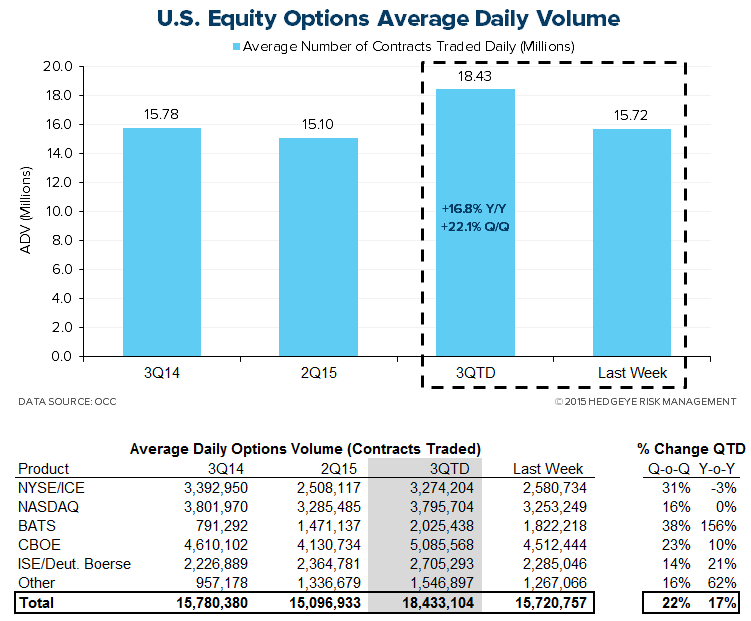
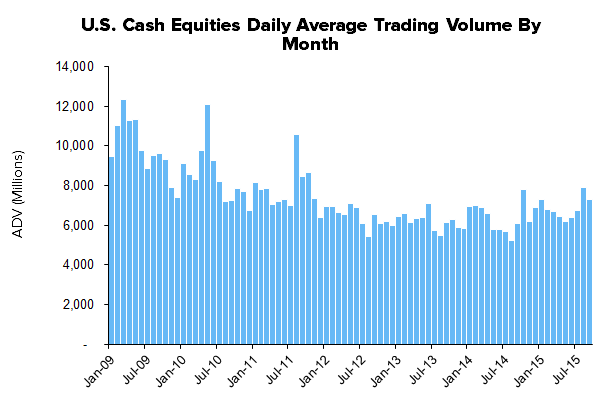
U.S. cash equity and options activity for the week were both lower than their 3QTD averages in light of the holiday. However, both categories continue to show impressive year-over-year and quarter-over-quarter growth. U.S. cash equity volume averaged 6.8 billion shares this week, bringing the third quarter to a 7.3 billion ADV, an expansion of +29% Y/Y and +15% Q/Q. U.S. equity options activity averaged 15.7 million contracts this week. Year-over-year growth in U.S. options is tracking at +17%.
U.S. Cash Equity Detail
U.S. cash equity trading finished the week at 6.8 billion shares traded which is blending to a 7.3 billion daily average thus far for the 3rd quarter of 2015. This is +29% year-over-year growth for U.S. stock activity. The market share battle for volume is mixed. The New York Stock Exchange/ICE's share of third-quarter volume remains at 24%. NASDAQ's share also remained unchanged week over week at 19%, 100 bps lower than last year, a -4% decline.

U.S. Options Detail
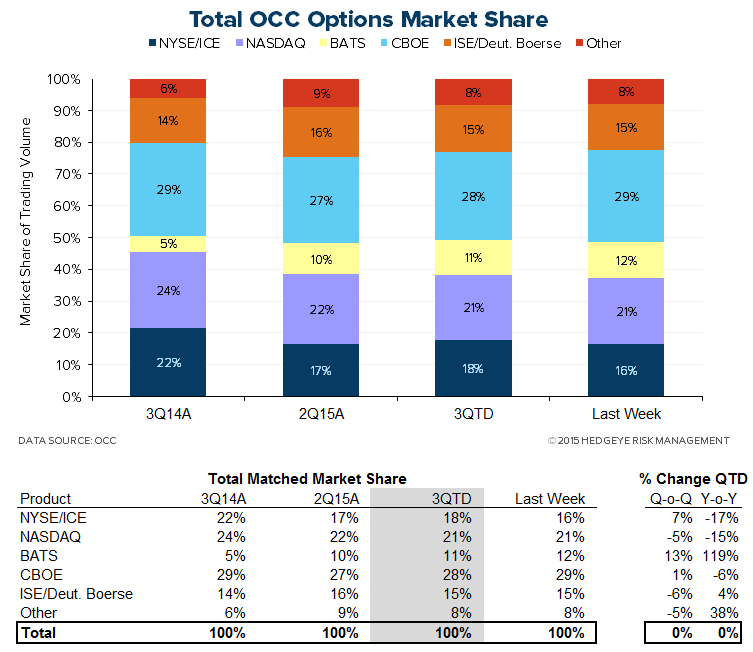
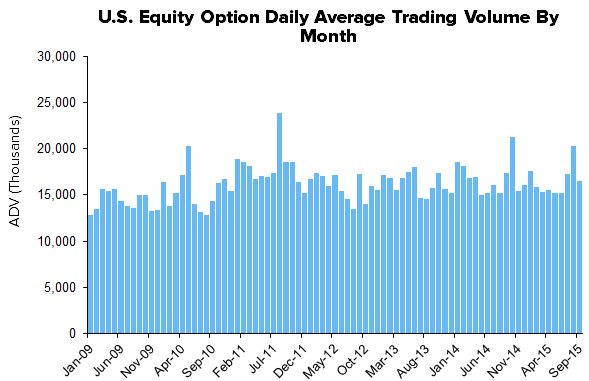
U.S. options activity came in at a 15.7 million ADV this week which is blending 3Q15 activity to 18.4 million contracts per day, up +22% quarter-over-quarter and +17% year-over-year. The market share battle amongst venues continues to be one of losses at both the NYSE/ICE and NASDAQ. NYSE has lost 400 basis points of share year-over-year settling at just 18% of options trading currently. NASDAQ has shed 300 basis points of share, good for a -15% loss from last year as ISE/Deutsche Boerse and BATS mop up volume and share.
U.S. Futures Detail
CME Group volume came in this week at 15.0 million contracts. That blends 3Q15 volume to a 14.6 million average level, a +8% year-over-year expansion. Additionally, CME open interest, the most important beacon of forward activity, continues in strong fashion. 104.8 million CME contracts are pending, good for +25% growth over the 84.1 million pending at the beginning of 2014, an expansion from the prior week's +23%.
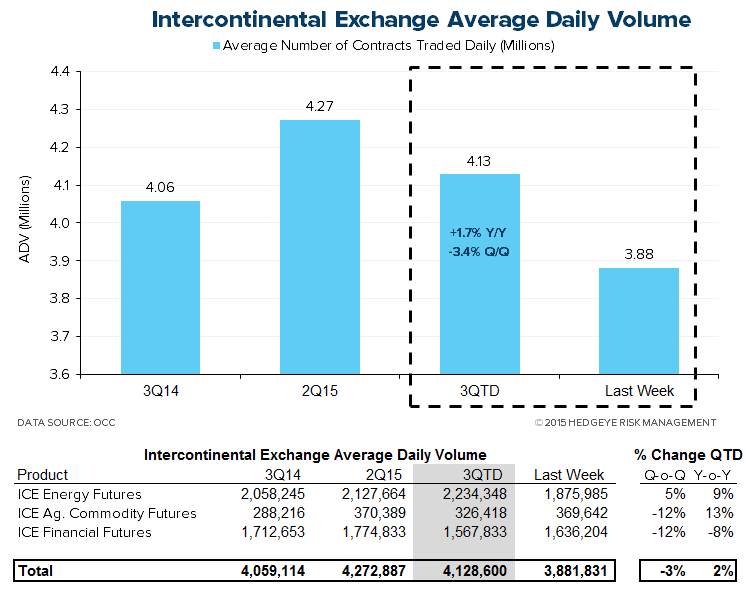
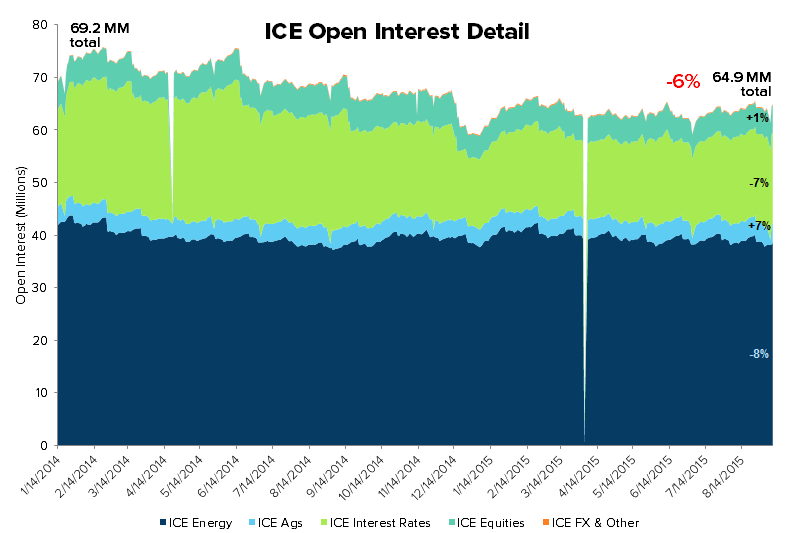
Activity levels on the futures side at ICE hit 3.9 million contracts this week, with 3Q15 blending to a 4.1 million daily average, a +2% year-over-year expansion. ICE open interest this week tallied 64.9 million contracts, a -6% contraction versus the 69.2 million contracts open at the beginning of 2014, an improvement from the prior week's -8%.


Monthly Historical View
Monthly activity levels give a broader perspective of exchange based trends. As volatility levels, measured by the VIX, MOVE, and FX Vol should rise to normal levels after the drastic compression this cycle, we expect all marketplaces to experience higher activity levels.


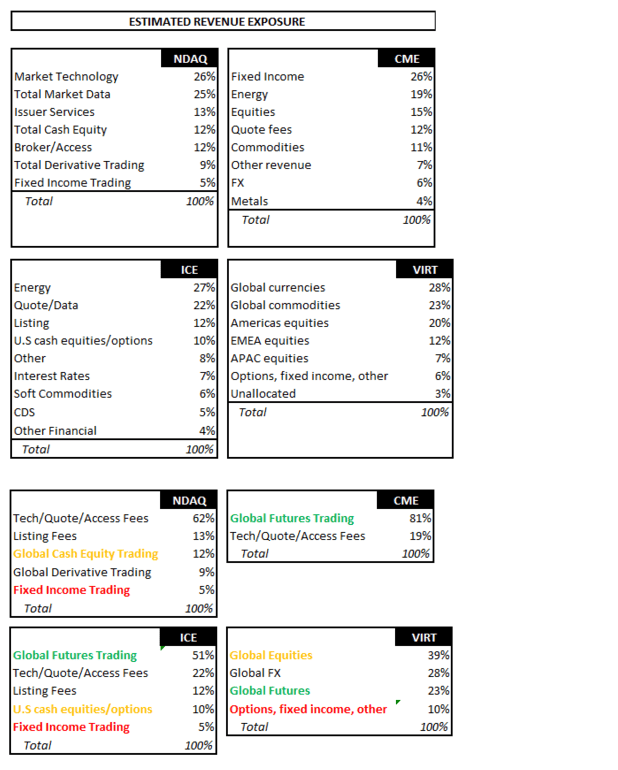
Sector Revenue Exposure
The exchange sector has broadly diversified its revenue exposure over 10 years as public entities with varying top line sensitivity to the enclosed trading volume data. The table below highlights how trading volumes will flow through the various operating models at NASDAQ, CME Group, ICE, and Virtu:
We recently presented our investment thesis on the Exchanges. To summarize,
- Long CME: Financially oriented CME Group (CME) is enjoying a long awaited boom in activity, as trader counts and open interest in Treasuries, Eurodollars, and FX products are swelling. The decade long concentration on trading energy and commodities is over and with steeply shaped forward curves and more profitable opportunities, financial products are seeing rapid adoption.
- Short ICE: We see collateral damage from the ongoing rapid price decline in energy and commodity markets. As a result, these important products at ICE will be less active than the Street expects, as commercial hedging and speculative energy trading dries up.
We think CME has $5 per share in earnings power in the out year and the stock will revisit near $140. As outlined in our presentation deck and replay below, a CME long position can also be paired with a short ICE position, with favorable fundamental exposures on each side of the trade.
Separately, recent IPO Virtu (VIRT) is being valued incorrectly by the market. Our main qualm is that the company takes intraday prop risk, but has no tangible equity capital to cover any potential trading losses. Shares of VIRT are currently on our Best Ideas list as a short with a fair value in the mid-teens (30-40% downside).
Hedgeye Exchange Black Book Replay HERE
Hedgeye Exchanges Black Book Materials HERE

Please let us know of any questions,
Jonathan Casteleyn, CFA, CMT
Joshua Steiner, CFA
