Our Hedgeye Housing Compendium table (below) aspires to present the state of the housing market in a visually-friendly format that takes about 30 seconds to consume.

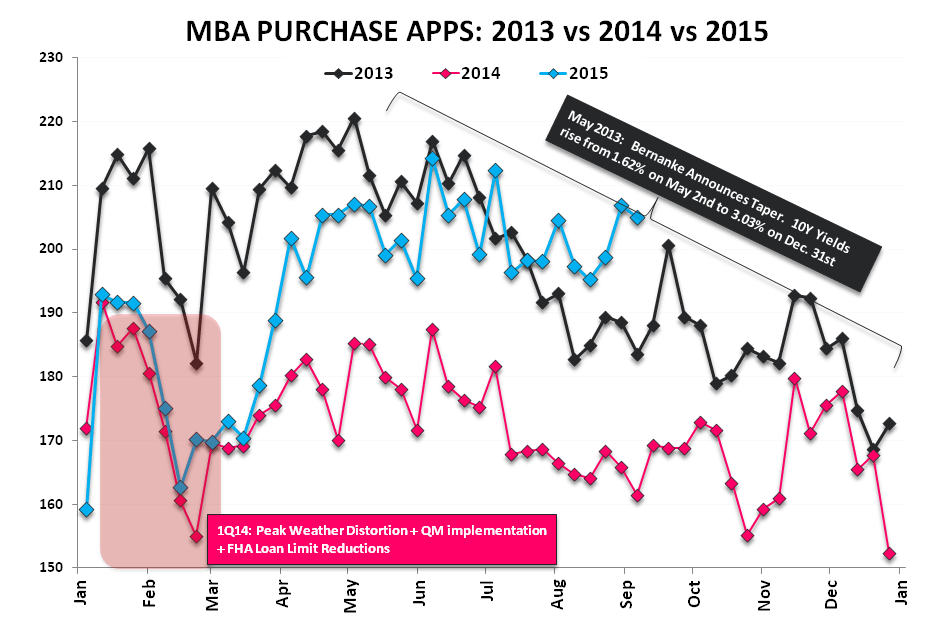
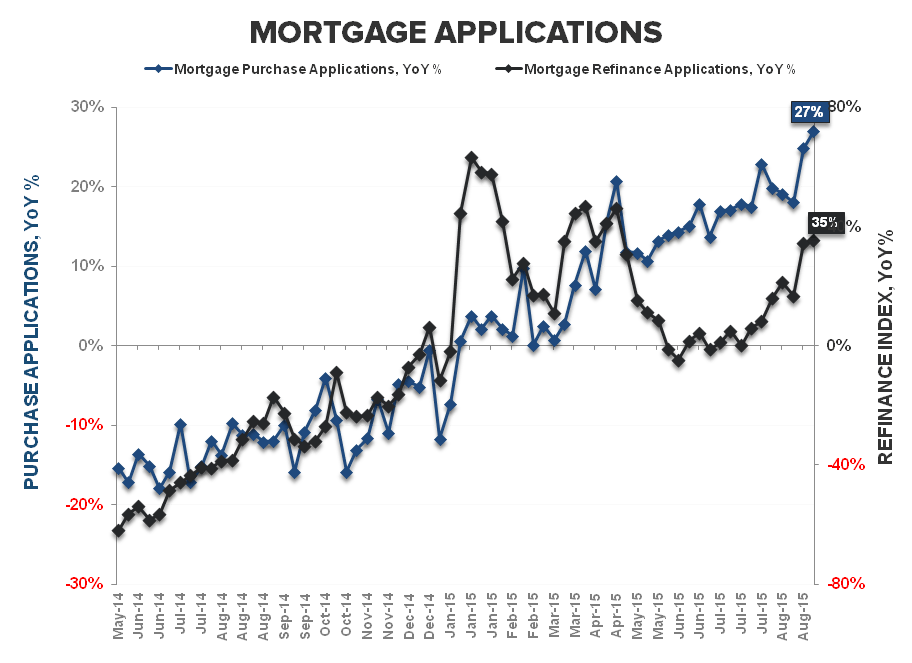
Purchase Apps: Soldiering into September | Purchase demand declined -0.9% WoW but held near the best levels QTD at 205 on the index. On a QoQ basis, 3Q is currently tracking -1.0% sequentially while, on a year-over-year basis, activity accelerated to +27% YoY against easing comps.
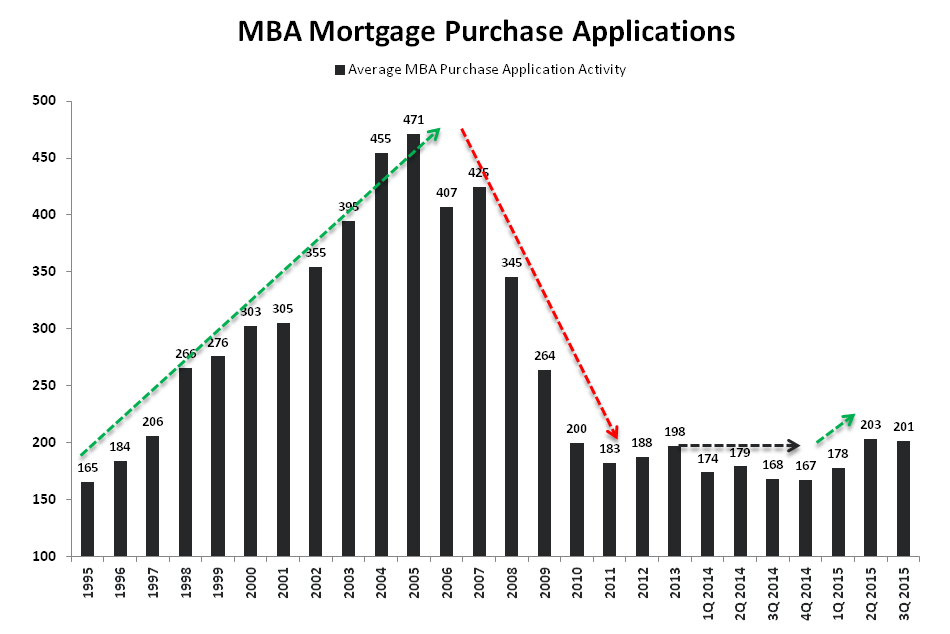
In short, purchase demand has seen a modest upswing to start September, remains “good” on an absolute basis and reported year-over-year growth should remain solid against easy 2H comps. However, as we’ve highlighted, the large-scale positive reversal in 1H15 which was characterized by remarkable YoY and QoQ growth is now rearview and organic strength will need to take the hand-off from easy compares to drive ongoing improvement. For now, Housing’s transit from Great --> Good remains a relative winner against the transit from Good --> Bad across the preponderance of global macro.
Refi & Rates: Rates ↓, Volatility & Affordability ↑ | Refinance activity dropped -10% in the latest week after ramping +16.8% the prior week ahead of back-to-school and alongside the expedited retreat in treasury yields. Rates on the 30Y FRM contract, meanwhile, rose +2bps WoW to 4.10% but remain well off the YTD highs recorded in late July. At current interest rates, affordability remains +4.4% better than the 2014 average and sits as a modest tailwind for HPI.
Big Picture | The big picture is that a potent factor cocktail alignment is occurring for housing on the long side as the confluence of seasonally strong 4Q/1Q trends (aka "the hope trade") converge with election year tailwinds (2016) (See our Note from earlier this morning: Election Cycle Analysis ==> Will Housing Trump the Market?. Meanwhile, HPI is accelerating (July +6.9% Y/Y vs June +5.6% Y/Y), and we've shown that HPI is a strong corollary to housing equity price performance. We'll delve into these topics and more in greater detail in our upcoming 4Q15 Housing Quarterly Themes call.


About MBA Mortgage Applications:
The Mortgage Bankers’ Association’s mortgage applications index covers more than 75% of mortgage applications originated through retail and consumer direct channels. It does not include loans delivered through wholesale broker and correspondent channels. The MBA mortgage purchase applications index is considered a leading indicator of single-family home sales and construction. Moreover, it is the only housing index that is released on a weekly basis.
Frequency:
The MBA Purchase Apps index is released every Wednesday morning at 7 am EST.
Joshua Steiner, CFA
Christian B. Drake